2017 County Yields
Published
2/28/2018
The 2017 average county yield estimates have been released by USDA/NASS which are shown in the maps below. Note that the individual corn yields for four counties - Clarke, Lucas, Decatur, and Wayne were not disclosed. For soybeans, the three counties not disclosed were Clarke, Decatur, and Wayne.
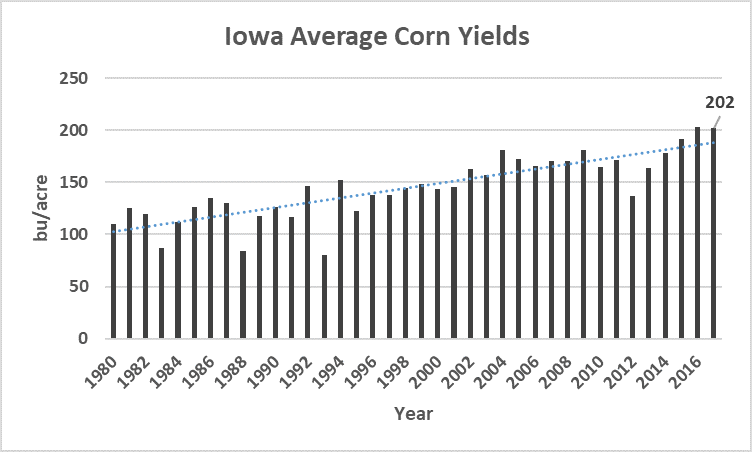
The 2017 state average corn yield was 202 bu/acre, only down slightly from 203 bu/acre in 2016. County level average corn yields in Iowa ranged from 107.3 bu/acre in Davis County to 222.4 bu/acre in Marshall County. The second tab in the map shows the 2017 county yields compared to the 10-year average yield for each county. As you can see, the majority of Iowa counties saw yields in 2017 that were greater than the 10-year average, with the exception of Davis and Van Buren, and possibly some of the non-disclosed counties in south central Iowa due to drought. Washington County had an average 2017 corn yield that was 50 bu/acre higher than their 10-year average, while Davis County’s 2017 yield was 26 bu/acre lower than the 10-year average in that county.
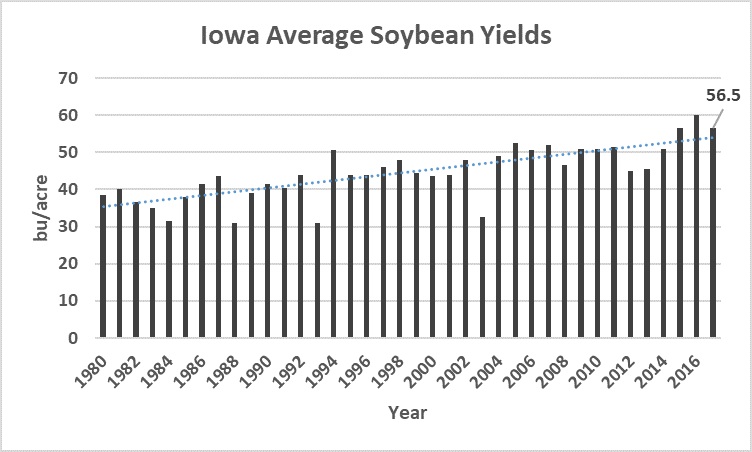
The 2017 state average soybean yield was 56.5 bu/acre, down from 60 bu/acre in 2016. County soybean yields ranged from 36.2 in Van Buren County to 64.6 bu/acre in Sioux County. Once again, most counties across the state saw soybean yields greater than their respective 10-year average yield, with the exception of several counties in the southern part of the state due to yield loss from dry weather. Guthrie County’s 2017 average soybean yield was over 10 bu/acre higher than the 10-year average, while Van Buren County was about 9 bu/acre lower in 2017 than the 10-year average.
Michelle Mensing is a Research Analyst with Decision Innovation Solutions (DIS). DIS is an Iowa-Based economic research firm which provides regular farm economics research and analysis to the Iowa Farm Bureau staff and members.
Want more news on this topic? Farm Bureau members may subscribe for a free email news service, featuring the farm and rural topics that interest them most!