What’s Cooking with Vegetable Oils
Author
Published
7/7/2022
World vegetable oil production is increasing with palm oil and soybean oil leading the way (Figure 1). Vegetable oil production has increased 37% in the past decade, growing from 145 million metric tons of production in 2012 to 199 million metric tons in 2022. All the major types of vegetable oils have experienced growth during the most recent decade with sunflowerseed oil (44% growth) and soybean oil (43% growth) exhibiting the strongest percentage growth. In raw volume, palm oil has had the most increase in production (22.7 million metric tons) followed by soybean oil (17.5 million metric tons).
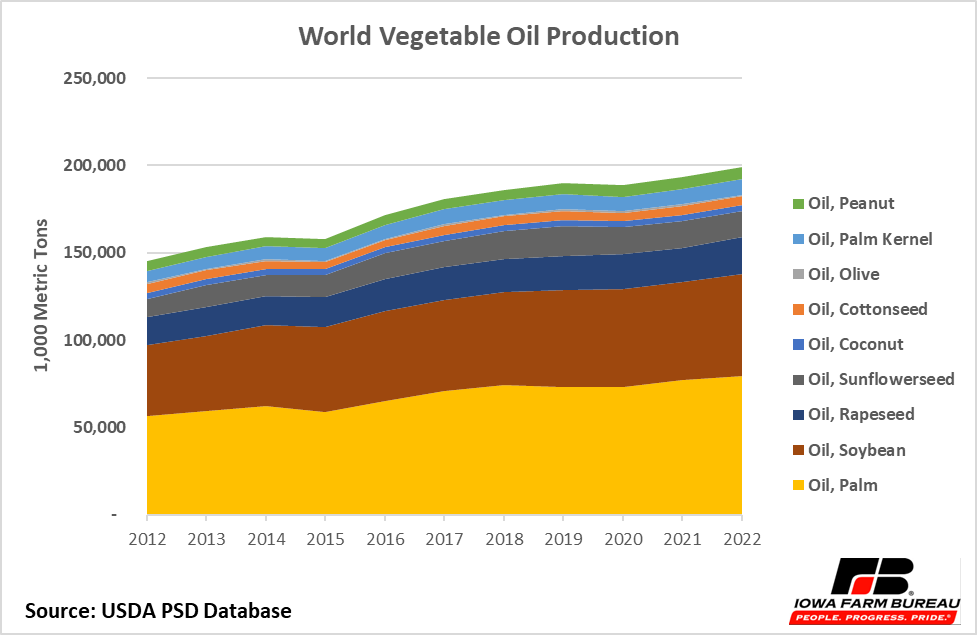
Figure 1. World Vegetable Oil Production
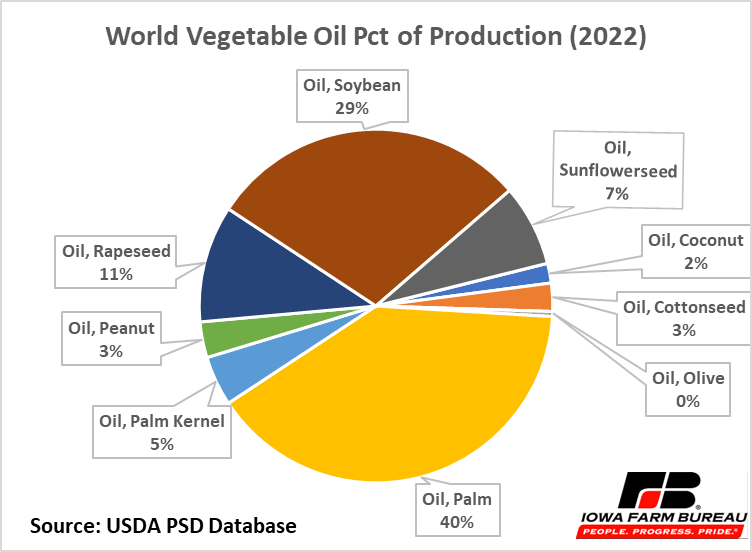

In 2022, palm oil is expected to account for 40% of world vegetable oil production, soybean oil 29%, rapeseed (canola) oil 11%, sunflowerseed oil 7% and the other vegetable oils accounting for 13% of production collectively (Figure 2).
The various vegetable oils tend to be used for cooking and industrial uses. Peanut oil is used almost exclusively for cooking (99%) whereas only 19% of palm kernel oil is used for cooking. In 2022 it is anticipated that 72% of all vegetable oils produced will be used for domestic food consumption. By type of oil, it is anticipated that 99% of peanut oil, 92% of rapeseed/canola oil, 89% of cottonseed oil, 82% of sunflowerseed oil, 80% of soybean oil, 62% of palm oil, 45% of coconut oil, and 19% of palm kernel oil will be used for domestic food consumption (Figure 3). These oils are used directly for frying and cooking and are also used as ingredients in food products.
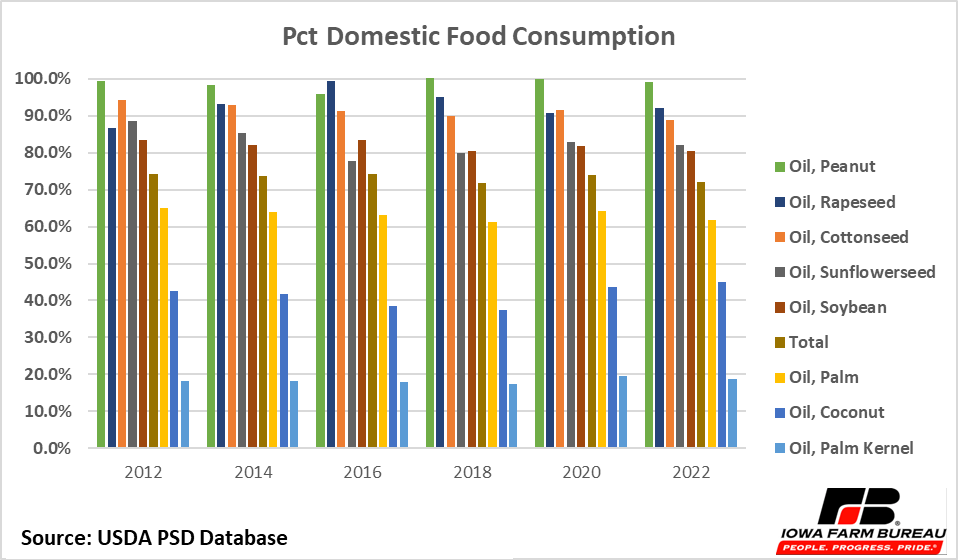
Figure 3. Pct Domestic Food Consumption
The percentage of each oil used for domestic food consumption is changing over time. In 2012, 83.5% of world soybean oil was used for domestic food consumption; by 2022 that has dropped to 80.4%. Palm oil, the most widely used vegetable oil, has dropped from 65.0% being used for food consumption in 2012, to 61.7% in 2022. Other vegetable oils that have seen their percent of use in foods decline include sunflowerseed oil (from 88.5% to 82.2%), and cottonseed oil (from 94.1% to 88.9%). Vegetable oils that have seen their percent of usage in food consumption increase include coconut oil (from 42.7% to 44.9%), palm kernel oil (from 18.3% to 18.9%), and rapeseed/canola oil (from 86.7% to 92.1%).
Vegetable oils are also used in industrial applications with one of the largest applications being biofuels, especially biodiesel. Industrial use has increased from 17.4% of all vegetable oils in 2012 to 21.6% in 2022. This year, 71.3% of palm kernel oil will be consumed in industrial use, 41% of coconut oil, 26.5% of palm oil, 19.5% of soybean oil, 10.6% of cottonseed oil, 6.9% of rapeseed/canola oil, 3.5% of sunflowerseed oil, and 0.2% of peanut oil (Figure 4).
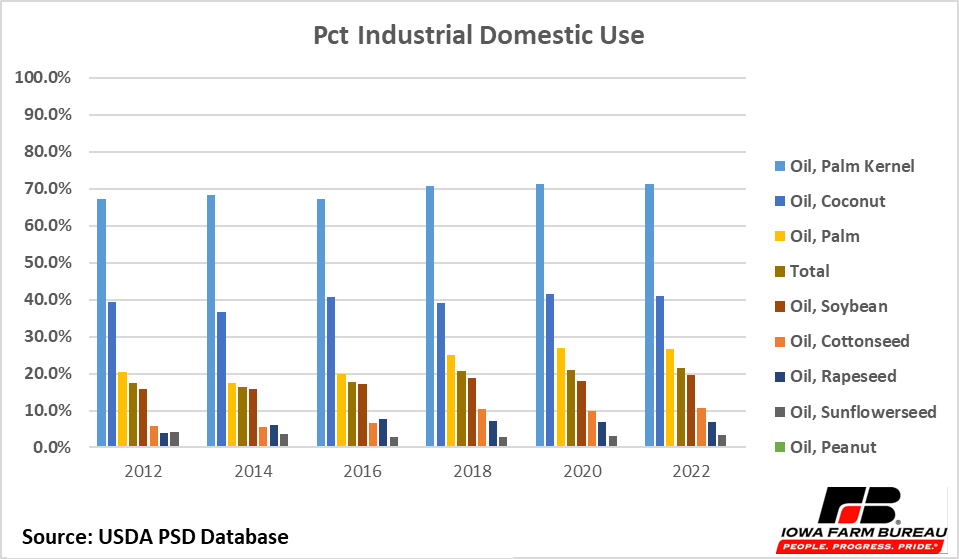
Figure 4. Pct Industrial Domestic Use
For soybean oil, industrial use has increased from 15.8% of production in 2012 to 19.5% of production in 2022. Much of that increase in use is for biodiesel. There are now 11 biodiesel plants in Iowa with a stated combined capacity of 470 million gallons per year (Figure 5). Nationally, there are 66 biodiesel plants with a total capacity of 2,634 million gallons per year.

Figure 5. Biodiesel Plants in Iowa
One forward forecast of renewable diesel production looking forward to 2030 suggests that current capacity may need to nearly triple by 2030 (Figure 6). In 2022, it is estimated that the U.S. is using about 8.1 million tons of vegetable oils for biodiesel, which is about 23% of global industrial use. Reaching the 2030 projection would increase U.S. vegetable oil feedstock use for biodiesel to nearly 21 million tons just for renewable diesel fuels. To put that in perspective, that would be equivalent to the soybean oil from 4.18 billion bushels of soybeans.
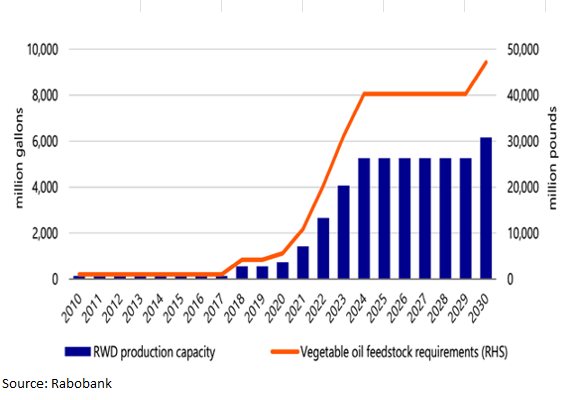
Figure 6 Rapid Ramp-up in US Renewable Diesel Production Capacity 2010-2030
Increasing the demand for vegetable oils will require new crush capacity. Plans have been announced for expansion of soybean crush capacity at 4 existing plants and for 9 new plants. If all that capacity comes on-line, it would total 430 million bushels of additional crush capacity (2022 soybean crush is currently estimated to be 2,255 million bushels) which would produce an additional 2.15 million metric tons of soybean oil, which would get us to about half of the projected vegetable oil needed to meet the goal in 2030 of 6 billion gallons of renewable diesel.
Re-engineering our energy and fuel sources poses many challenges and one of them will be balancing the production of vegetable oil feedstocks for renewable diesel which will require a re-balancing of crop mixes, an expansion of crush capacity, and developing significant, new and/or expanded markets for the soybean meal and other protein products that result from crushing oilseeds.
Soybean oil prices have been in an uptrend since April 2020. Prices reached a daily high of $91.40 on April 29, 2022 and a near-term monthly high of $87.55/cwt ($11.51/gallon) in May 2022. Soybean oil prices have retreated from that high throughout the month of June 2022 and have continued the downward slide into July 2022, breaking below $60/cwt on July 5, 2022, a decline of 33% in just 10 weeks (Figure 7).
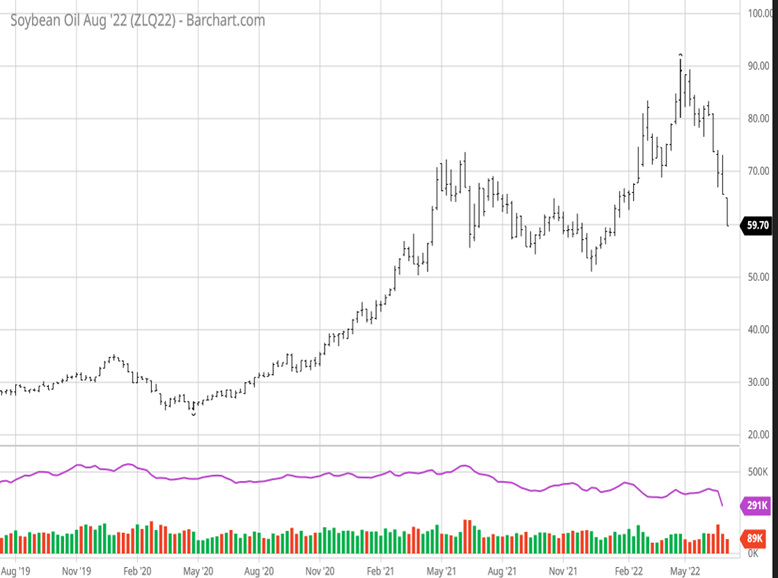
Figure 7. Soybean Oil Weekly Futures Prices

Figure 9 shows the relationship between biodiesel prices and soybean oil prices. For every $1/cwt increase in soybean oil prices, biodiesel prices increase by 7 cents per gallon. And monthly soybean oil price explains 92% of the variation of monthly biodiesel prices (Figure 9).
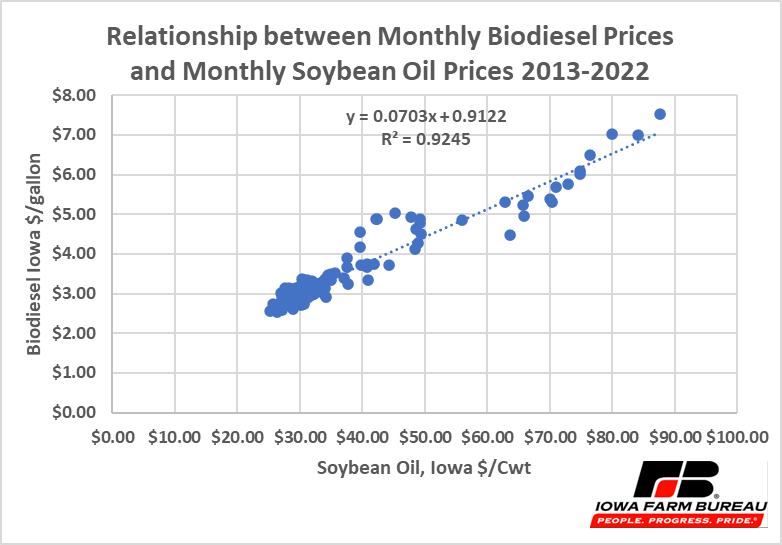
Figure 9. Relationship between Monthly Biodiesel Prices and Monthly Soybean Oil Prices, 2013-2022
With crude oil and soybean oil prices declining in the past few days, it is likely that diesel and biodiesel prices will also decline in the near-term.
Economic analysis provided by David Miller, Consulting Chief Economist, Decision Innovation Solutions on behalf of Iowa Farm Bureau.
Want more news on this topic? Farm Bureau members may subscribe for a free email news service, featuring the farm and rural topics that interest them most!