USDA Releases Delayed November WASDE after Skipping October Report
Author
Published
11/19/2025
Corn
The USDA’s corn yield estimate decreased by 0.7 bushels per acre to 186.0 bushels per acre in the November report (Figure 1). This represents a 3.7% increase from the 2024 corn yield. The current U.S. trend yield is increasing by 1.88 bushels per acre per year since 1996.
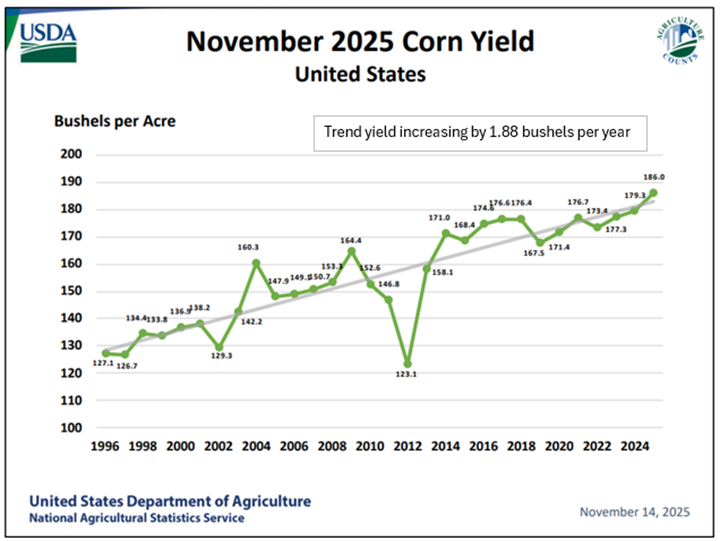
Figure 1. U.S. Corn Yield
Iowa experienced a record high corn yield of 216 bushels per acre, a 2.4% increase from November 2024 (Figure 2). Iowa’s trend yield is increasing by 2.35 bushels per acre per year since 1996.
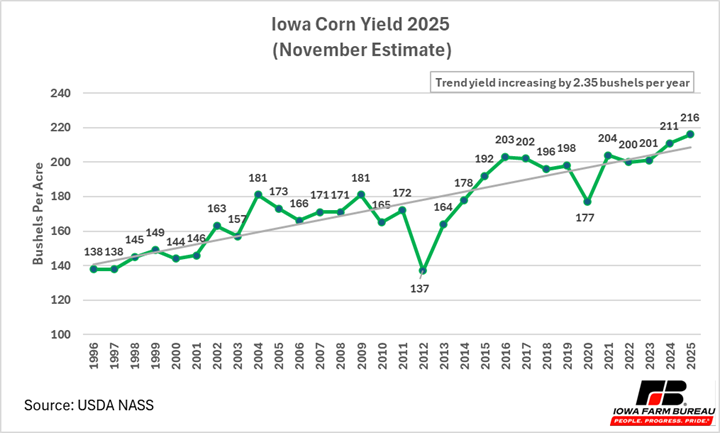
Figure 2. Iowa Corn Yield
Illinois also had a record high yield of 221 bushels per acre, a 1.8% increase from last year. Idaho boasts the highest yield in the country at 227 bushels per acre, a 01.2% increase from 2024. Missouri saw yields decrease by 2.7% to 178 bushels per acre. Other notable states with increased yields include Indiana, Kansas, Nebraska, North Dakota, and Ohio (Figure 3)

Figure 3. November 2025 Corn Yield, Bushels and Percent Change from 2024
Soybeans
The projected national soybean yield is 53.0, a 4.5% increase from 2024 (Figure 3). Although the projection fell by 0.9% from the September report, it still represents a record yield. Trend yield for U.S. soybeans is currently increasing by 0.57 bushels per acre since 1996.
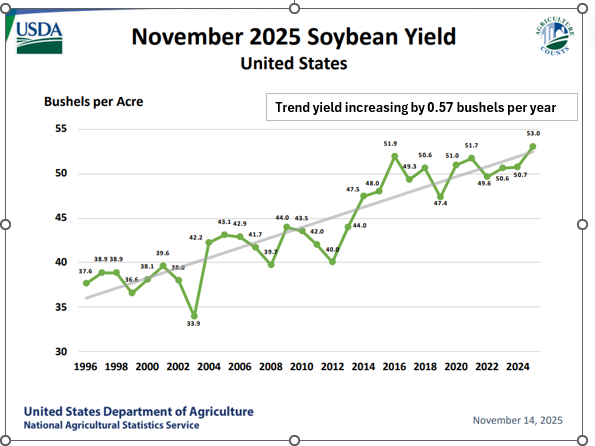
Figure 4. U.S. Soybean Yield
Iowa’s soybean yield increased by 8.3% to 65 bushels per acre, a record high yield. Trend yield of Iowa soybeans is currently increasing by 0.63 bushels per year since 1996 (Figure 5).

Figure 5. Iowa Soybean Yield
Illinois also had a record high yield with a yield of 65 bushels per acre, a 1.6% increase from 2024. Nebraska also experienced a record high yield of 64 bushels per acre, an 11.3% increase from 2024. Other notable soybean production states that saw increased yields include Kansas, Minnesota, Missouri, North Dakota, and Ohio (Figure 6).
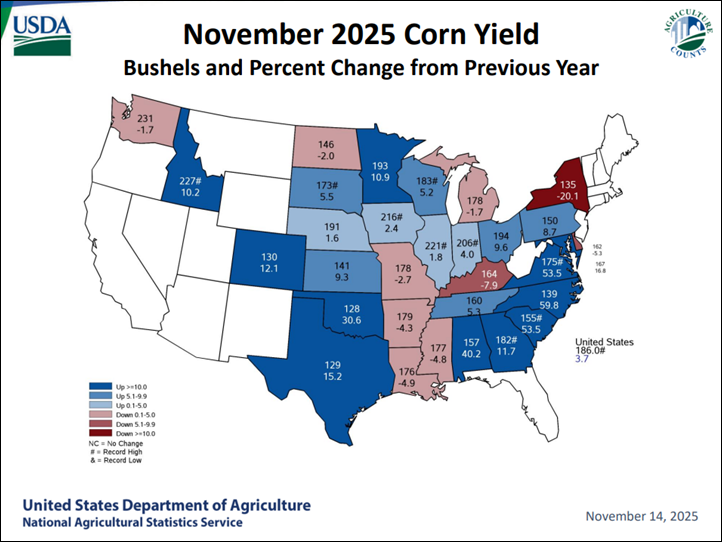
Figure 6. November 2025 Soybean Yield, Bushels and Percent Change from 2024
Want more news on this topic? Farm Bureau members may subscribe for a free email news service, featuring the farm and rural topics that interest them most!