USDA March 1 Grain Stocks Report Recap
Author
Published
4/4/2023
USDA released its quarterly estimate of US Grain stocks on March 31, 2023. These estimates for grain stocks are as of March 1st, 2023. The report provided bullish news to the market, showing tighter than expected stocks for both corn and beans (Table 1).
Table 1. US Grain Stocks as of March 1, 2023 (billion bushels)
Corn
US corn stocks were estimated at 7.401 billion bushels, 4.6% lower than this time last year. On farm storage held 4.106 billion bushels while off farm storage accounted for the remaining 3.295 billion bushels. Despite tight supplies, on-farm storage was up 0.6% from last year, while off-farm storage was 10% lower than levels a year ago.
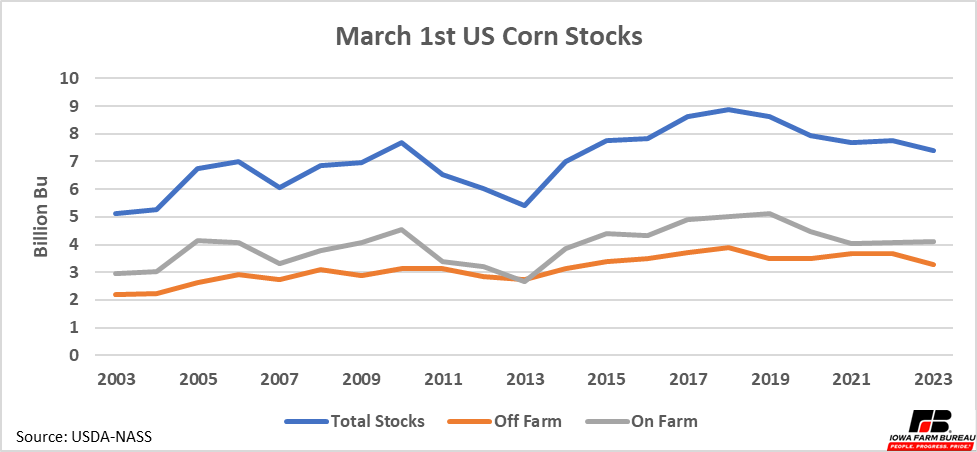
Figure 1. March 1st US Corn Stocks
Soybeans
US soybean stocks were estimated at 1.685 billion bushels, 13% lower than this time last year. On farm storage held 749.5 million bushels while off farm storage represented the remaining 935.9 million bushels. Accentuating the tight supplies, on-farm storage was down 0.1% from last year, but off-farm storage was 20.8% lower than levels a year ago. This is the lowest level of off-farm soybean stocks in March since 2016.
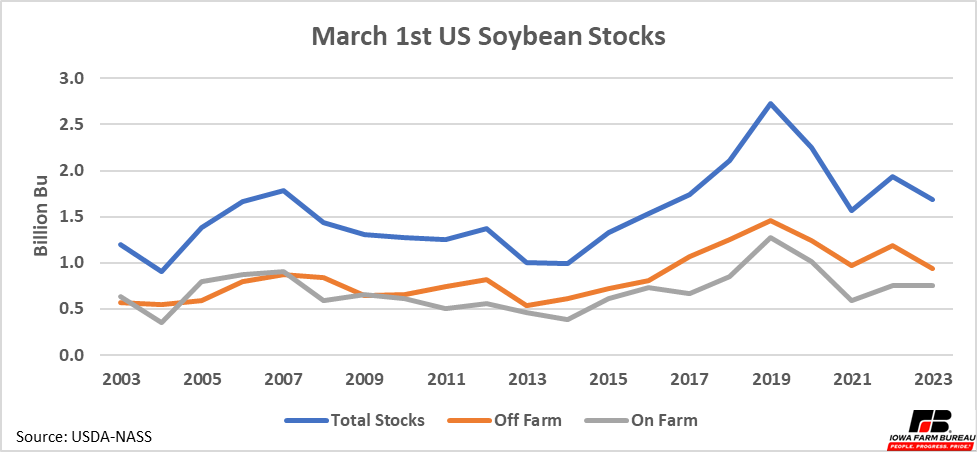
Figure 2. March 1st US Soybean Stocks
Stronger Demand or Lower Production
Following the USDA stocks report, the nearby corn contract closed $0.11 higher, and the nearby soybean contract gained $0.31, as trade overestimated stocks for both grains.
Stocks could have been overestimated because either demand was underestimated, supply was overestimated, or some combination of the two.
Exports sales for both corn and soybeans have been slow so far this year. Corn exports have continually been behind expectations (Figure 3). Soybean exports sit on target with this year’s WASDE projection, but this year’s estimates are lower than exports in the 2020/21 and 2021/22 marketing years (Figure 4).
On the domestic demand side, relatively high grain prices likely have kept domestic demand in check. For instance, corn for ethanol use has consistently bene below year ago levels to start off this marketing year (Figure 5). Unless feed or other industrial use is much higher than anticipated, it is possible corn production estimates from last year will be adjusted down to account for low stocks in the March stocks report.
If last year’s production is in fact lower than expected this would also affirm that the quantity of corn demanded by the market is weakening, or at least is not showing signs of strength. However, if either demand is strengthening or production last fall was lower it does not change the fact that stocks will continue to be tight until harvest next year and this should offer price support to old crop corn and soybeans through the back half of the marketing year.
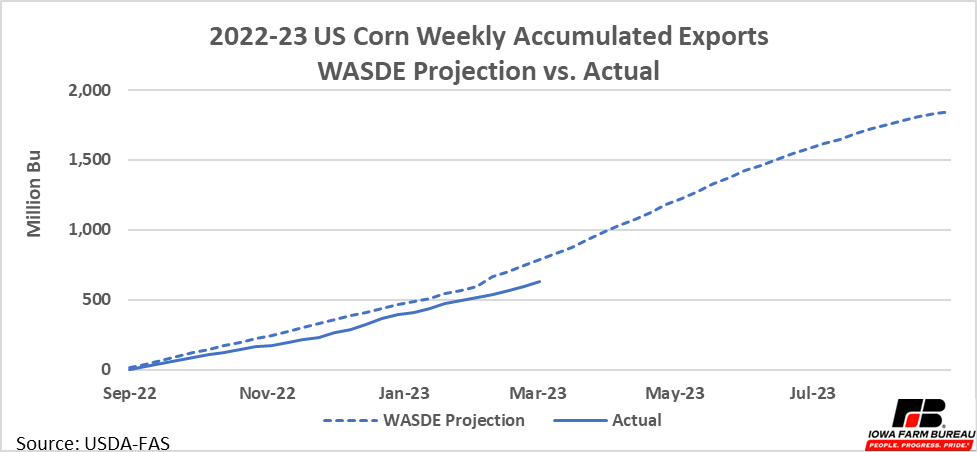
Figure 3. 2022-23 US Corn Weekly Accumulated Exports WASDE Projection vs. Actual
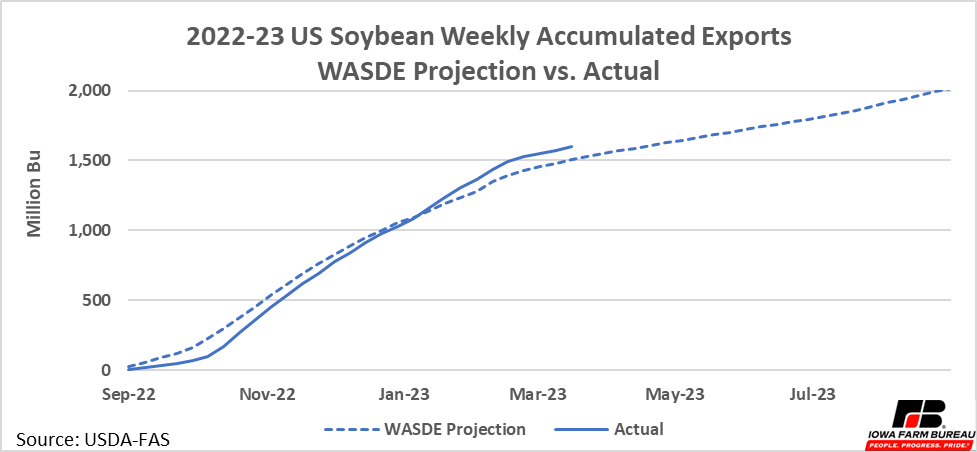
Figure 4. 2022-23 US Soybeans Weekly Accumulated Exports WASDE Projection vs. Actual
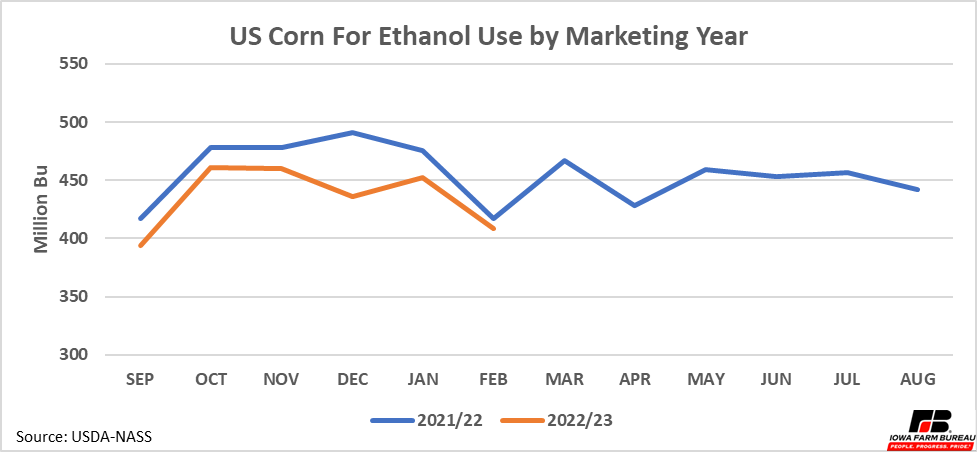
Figure 5. US Corn for Ethanol Use by Marketing Year
Want more news on this topic? Farm Bureau members may subscribe for a free email news service, featuring the farm and rural topics that interest them most!