U.S. Pork Exports Update
Author
Published
8/5/2015
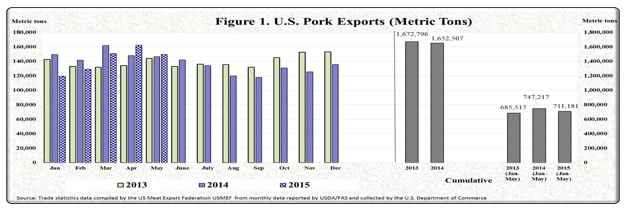
U.S. pork exports during the first five months of 2015 reached a volume of 711,181 metric tons, 3.7% above the amount of pork exported in 2013 (685,517 metric tons) during the same five-month period, but down 4.8% from the volume exported from January to May 2014 (742,217 metric tons) (see Figure 1). At the beginning of 2015, U.S. pork exports were negatively impacted by severe traffic congestion in the West Coast ports; however by April, U.S. pork exports registered the largest export volume (162,394 metric tons) of the year. Moreover, this was the largest monthly volume since March 2014 (161,858 metric tons). May 2015 exports (148,474 metric tons) were up 2% year-over-year (146,491 metric tons) but down 8% from previous months.
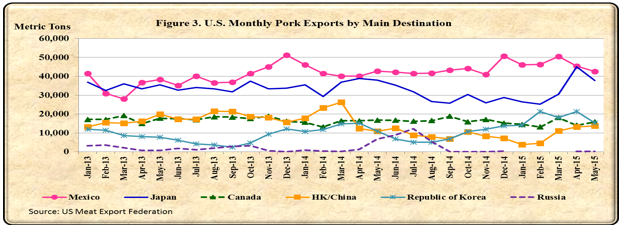
Mexico and Japan continue as the main importers of U.S. pork. However, pork shipments to Mexico and Japan during May 2015 were down 6.2% to 42,753 metric tons and 16.2% to 37,824 metric tons, respectively, compared to the volume exported in April 2015 (see Figure 2). Although not a substantial decline, year-over-year, May exports to Mexico and Japan were down 0.2% and 0.1%, correspondingly. From January to May 2015 pork export volume to Mexico (230,917 metric tons) was 9.7% above 2014 exports during the same period (210,451 metric tons). In contrast, shipments to Japan during the first five months of 2015 (165,061 metric tons) were down 7.5% relative to 2014 volume exported (178,403 metric tons) during the same time.
U.S. pork exports to Korea in May 2015 were up 41% to 15,373 metric tons compare to a year ago (10,879 metric tons), nonetheless exports in May fell 27.7% from the previous month’s volume (21,250 metric tons). Despite this reduction, U.S. pork exports to Korea from January to May 2015 remain ahead 43% to 90,212 metric tons compared to the same period last year (63,094 metric tons).
The volume of U.S. pork shipped to Canada this year (75,584 metric tons, January to May) was 4% lower than the volume dispatched during the first five months of 2014 (78,452 metric tons). Yet exports in May 2015, increased 13% to 15,834 metric tons in contrast to last month’s volume (14,008 metric tons). This was the second largest shipment to Canada this year following the volume exported during March 2015 (18,104 metric tons) (see Figure 2).
U.S. pork exports to Hong Kong/China in 2015 (January to May) have decreased 49% to 46,477 metric tons in contrast to the volume shipped in 2014 (90,490 metric tons, January to May). U.S. pork exports to China have been restrained by China’s enforcement of its ractopamine residues in pork ban. The ban limits the number of U.S. pork plants eligible to supply U.S. pork in China. In addition, the U.S. Meat Export Federation (USMEF) indicated that the Russian ban on meats has created an excess supply of lower-priced European Union (EU) pork production. This excess EU pork production has been effectively marketed not only in the Chinese market, but in the Japanese market as well. Other markets that have increased their pork imports from EU are the Philippines, Taiwan, Singapore, Australia, and Korea.
According to the latest (July 16, 2015) Livestock, Dairy, and Poultry Outlook report, USDA has forecasted a 7.6% increase to 24,581 million pounds in total commercial pork production during 2015, relative to the level of pork production last year (see Table 1). Factors that support this forecast are improved pork productivity due to a reduction in the number of Porcine Epidemic Diarrhea virus (PEDv) cases, increased volumes of live hog imports from Canada and heavy dressed weights.
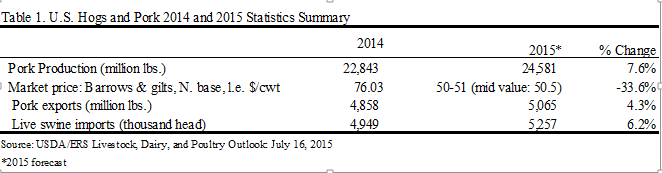
Due to the larger expected production, USDA has projected a decline in hog and pork prices for the rest of 2015. With lower prices and despite a strong U.S. dollar, USDA has forecasted a 4.3% increase in U.S. pork export in 2015 (5,065 million pounds) relative to the level of exports in 2014 (4,858 million pounds).
Want more news on this topic? Farm Bureau members may subscribe for a free email news service, featuring the farm and rural topics that interest them most!