The U.S. Agricultural Exports and their Relationship with Exchange Rates
Author
Published
12/27/2023
Although it varies by commodity (see Figure 1), overall, about 20% of U.S. agricultural production is exported. Year-to-year changes in U.S. agricultural exports can be affected by exchange rates as they indicate the relative price of U.S. agricultural products in foreign markets. When the U.S. dollar appreciates (stronger dollar), U.S. exports cost more in foreign market currencies, bringing both lower demand for U.S. agricultural products and reduced competitiveness of U.S. agricultural products in those markets. In contrast, when the dollar depreciates (weaker dollar), the relative cost of U.S. agricultural products in global markets decreases, and U.S. agricultural competitiveness boosts, bringing growth in U.S. agricultural product exports and increases in cash receipts for U.S. producers.
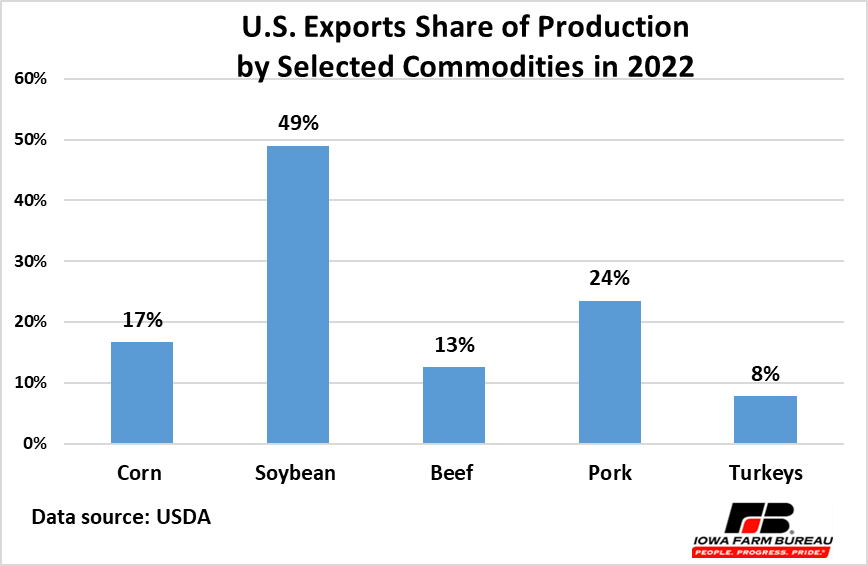
Figure 1. U.S. Exports Share of Production by Selected Commodities in 2022
Most of the world trade is conducted in U.S. dollars. The amount of one currency that can be traded for another is called nominal exchange rate. For example, if the nominal exchange rate between the U.S. dollar and the Mexican peso is 20.127 pesos per dollar, them one U.S. dollar can buy 20.127 pesos in the foreign exchange market. Conversely, 20.127 pesos can buy one U.S. dollar in the foreign exchange market.
The nominal exchange rates in the USDA-ERS Agricultural Exchange Rate Data Set are calculated in terms of local currency per U.S. dollar. Based on nominal exchange rates, real exchange rates are computed for each country using the ratio of national to U.S. consumer price index (CPI).
The market exchange rates estimated by USDA-ERS, indicate the relative value of the U.S. dollar in important export markets for the covered commodities, products, and product aggregates, which include major U.S. agricultural trade commodities. A country’s share in U.S. exports is used as a weight in the market index estimates, which assess the effect that variations in exchange rates have on importer markets of U.S. agricultural commodities.
An increase in the trade-weighted exchange rate implies an appreciation of the U.S. dollar, compared with the currencies of the U.S. major trading partners (and U.S. exports would tend to decline). A decline in the trade weighted exchange rate indicates a depreciation of the U.S. dollar relative to the U.S. key trading partners (and U.S. exports would tend to increase).
Figure 2 shows U.S. real annual agricultural trade-weighted exchange rate index and U.S. real agricultural exports during the 2000 to 2022 period. For the most part, when the dollar depreciated relative to U.S. trading partners (when exchange rate index declined), U.S. agricultural exports displayed an upward trend, and conversely. However, in 2022 both the exchange rate index and U.S agricultural exports moved in an upward direction, which contradicts the expected economic relationship between these two variables.
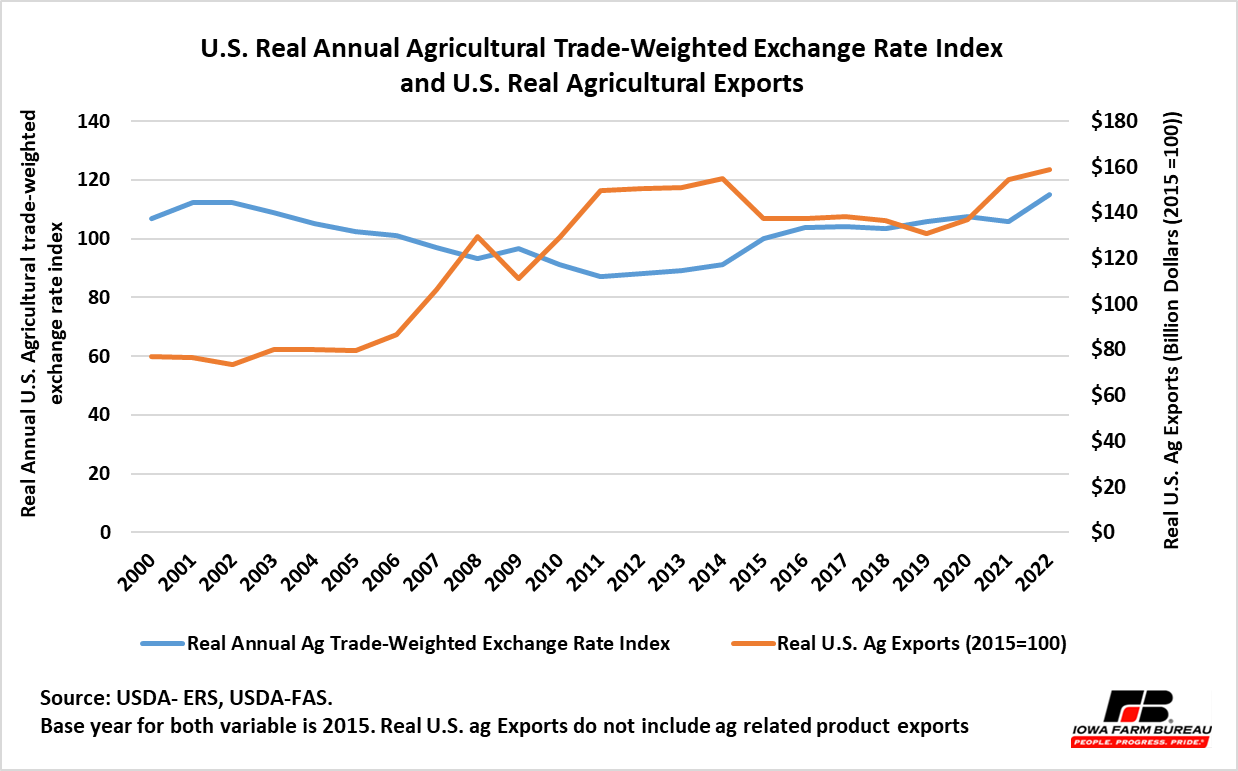
Figure 2. U.S. Real Annual Agricultural Trade-Weighted Exchange Rate Index and U.S. Real Agricultural Exports
The correlation coefficient[1] between real annual agricultural trade-weighted exchange rate index and U.S. agricultural exports for the period of 2000 to 2022 had a value of -0.43, which indicates a moderate negative relationship. The negative relationship indicates that over the long-term when the real U.S. exchange rate increases by 1%, real U.S. export values decline by 0.43%, and likewise when the real U.S. exchange rate decreases by 1% the value real U.S. export values increases by 0.43%.
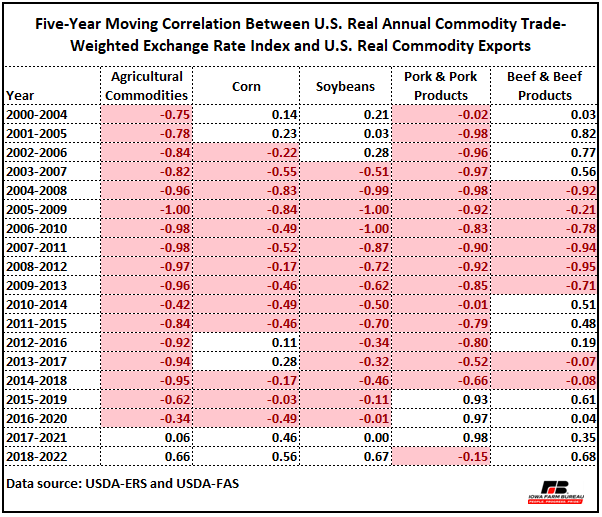
Although the impact of exchange rates mostly happens in the short term, to evaluate the changes throughout the 23 years of data, a five-year moving correlation between U.S. real annual commodity trade-weighted exchange rate index and U.S. real commodity exports was estimated. The table below illustrates that the relationship of the general exchange rate index with total agricultural exports (U.S. real agricultural trade-weighted exchange rate index and U.S. agricultural exports) can be different at the individual commodity level, in part due to the varied market destinations for individual U.S. agricultural commodities, their different exchange rate levels, and overall economic situations.
Table 1. Five-year Moving Correlation Between U.S. Real Annual Commodity Trade-Weighted Exchange Rate Index and U.S. Real Commodity Exports
Although exchange rates are an important driver on the level of agricultural trade, there are other factors that impact trade, including global supplies and prices, government policies that support agriculture, gross domestic product (GDP), free trade agreements, among others. Global exportable supplies can be affected by factors such as weather and conflicts (wars).
According to the USDA, its long-term agricultural projections for the period that starts in 2023 and ends in 2032, the projected U.S. dollar points to a marginal depreciation of the U.S. dollar compared to other currencies.
[1] The correlation coefficient is a statistical measure of the strength and direction of the linear relationship between two (continuous) variables. In general, a correlation coefficient value can range from -1 to +1. Either of these two extremes indicates a perfect linear relationship (i.e., a change in one variable is associated by a consistent change in the other variable).
Want more news on this topic? Farm Bureau members may subscribe for a free email news service, featuring the farm and rural topics that interest them most!