Prediction of 2018 Corn and Soybean Production and Yields
Published
10/18/2018
2018 Corn and Soybean Production
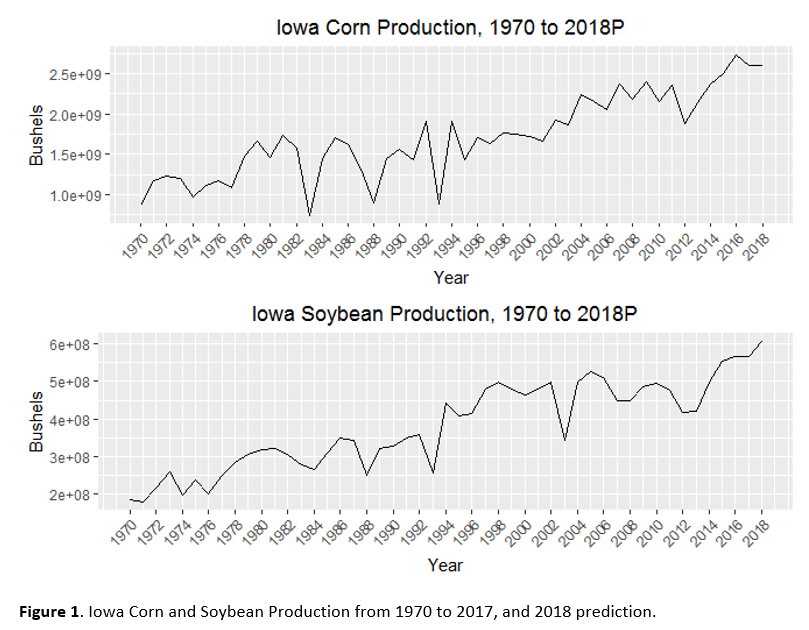
In Iowa, the harvesting season for both corn and soybean is underway. “U.S. farmers are expecting higher production of soybeans, while expecting a slightly decreasing corn production”, according to the Newsletter from USDA. For Iowa, it shows exactly the pattern that farmers expected, compared to previous years for both corn and soybeans. Corn production is down 0.18 percent from 2017, forecast at 2.601 billion bushels, lower than the record-high in 2016, 2.741 billion bushels. And increasing 7 percent from 2017, soybean production is forecast at 0.61 billion bushels. The USDA’s World Agricultural Supply and Demand Estimates was published on Oct 11th, 2018. The historical annual production for corn and soybeans from 1970 to 2018 is shown in Figure 1. The 2018 production is a forecast indicated as 2018P.
2018 Yields
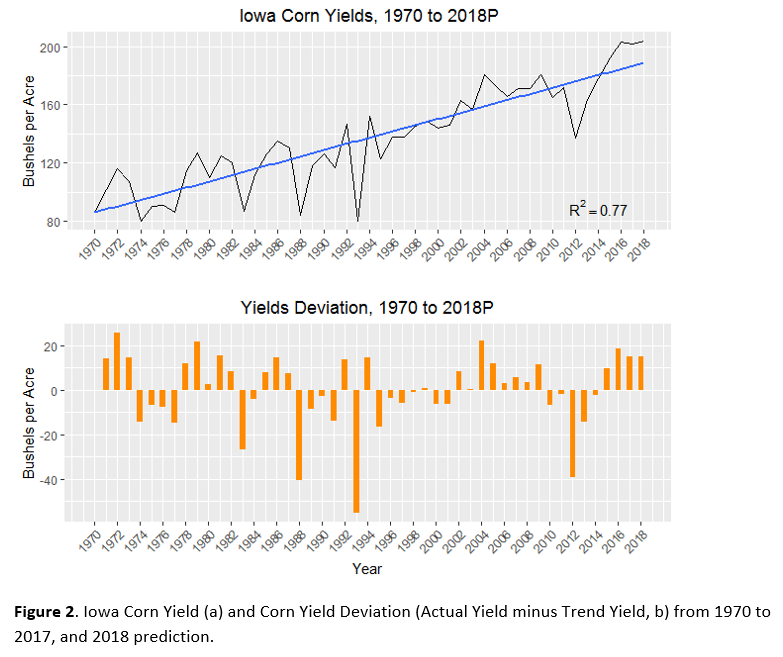
According to the Crop Production report published by the National Agricultural Statistical Service (USDA-NASS), the 2018 average corn yield for Iowa is projected at 204 bushels per acre, which is a slight increase compared with the 202 bushels per acre in 2017.
Figure2a, shows the Iowa corn yield from 1970 to 2017 and 2018 projection. The black line represents the actual yield for each year, and the blue line represents the trend yield. The trend yield was applied to the previous 40 years of yield data, and fitted a linear regression, with R2 = 0.77. A linear regression model is used to calculate the 2018 yield, shown as 2018P, which is 188.89 bushels per acre. The deviations between the actual yield and trend yield are shown in Figure1b. After 2014, yields in the most recent three years are above trend; 9.54 bushels above trend in 2015, 18.40 in 2016, 15.25 in 2017, and 15.11 in 2018. During the 2004-2009-time period, a continuous six years above the trend situation was observed, but not as stable as the recent three years interval, shown in Figure 2b.
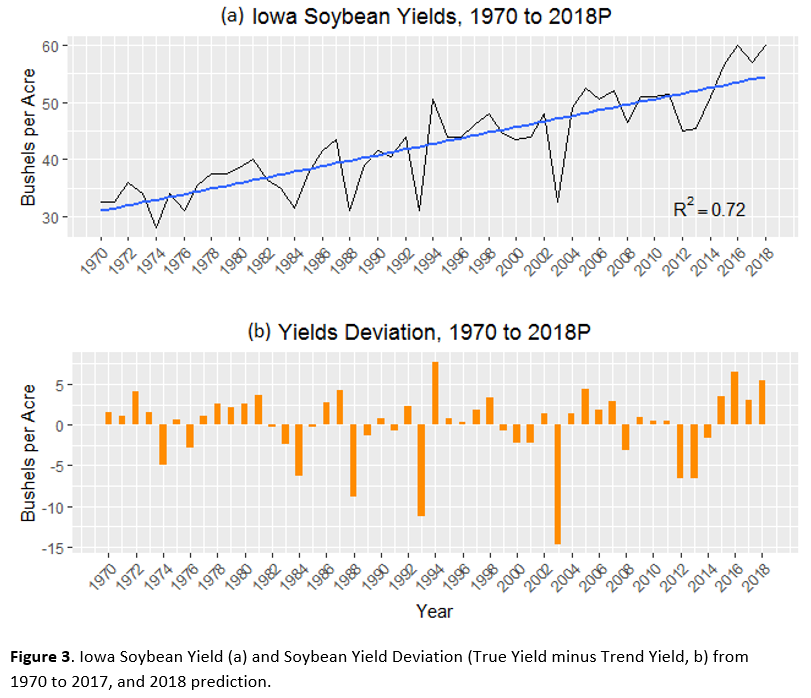
USDA-NASS projected the 2018 average yield of soybeans will be 61 bushels per acre for Iowa, becoming the new record-high, after the one recorded in 2016 of 60 bushels per acre. Figure3a shows the Iowa soybean yield from 1970 to 2017 and 2018 projection. The black line represents the true yield for each year, and the blue line represents the trend yield. The same method for trend yield calculation was applied, with R2 = 0.72. The prediction of 2018 trend yield is 54.60 bushels per acre. The deviation of soybean yield and trend yield has the same pattern as the corn yield, shown in Figure3b; 3.38 bushels above trend in 2015, 6.39 in 2016, 2.89 in 2017, and 6.4 in 2018. From the beginning of the study period, only three years have shown deviations more than 5 bushels than trend yield, i.e., 7.74 in 1994, 6.39 in 2016, and 6.40 in 2018.
Expectations for 2019 Yields
An alternative way to build expectations for the crop yield for the coming year is using the Trend-Adjusted Actual Production History (TA-APH) yield from crop insurance. Based on the Trend-Adjusted Actual Production History Standards Handbook, published by USDA Risk Management Agency on December 2017, the approved APH yield of corn is 205.25 bushels for Iowa, where the trend adjustment sets to 2 bushels. It is 5 bushels higher than the four-year average yield (200.25 bushels per acre). The approved APH yield of soybean for Iowa is 59.875 bushels, where the trend adjustment equals 0.5 bushels. The TA-PAH yield of soybean is 1.25 bushels higher than the four-year average yield (58.625 bushels per acre) for the State of Iowa.
Jing Tang is a Statistician with Decision Innovation Solutions (DIS). DIS is an Iowa-Based economic research firm which provides regular farm economics research and analysis to the Iowa Farm Bureau staff and members.
Want more news on this topic? Farm Bureau members may subscribe for a free email news service, featuring the farm and rural topics that interest them most!