Overview of Prevent Plant
Author
Published
5/17/2023
Prevent planting provisions in crop insurance policies provide payments to producers when certain covered events prevent planting. In general, most covered events are weather related. Excess moisture is by far the most common cause of loss (Table 1).
Table 1. Percent of Prevent Plant Acres in the US by Primary Cause of Loss (1996-2022)

The program is not intended to offset potential issues with farm management. For example, insufficient machinery or insufficient labor are not covered causes of loss.
Crop insurance providers ultimately decide whether a prevent plant claim is legitimate. One of the first factors they look at is if nearby fields with similar characteristics were planted or not. Since most causes of loss are weather related, typically more than one field or producer is affected in an area. There are no specific thresholds an area must meet for acres in an area to receive a prevent plant payment. It simply comes down to the judgment of the crop insurance provider.
Fields do not necessarily have to be in regions of high prevent plant acres to qualify for a prevent plant payment. Crop insurance agents inspect all fields that apply for prevent plant payments, in part, to verify cause of loss. If the cause of loss is not obvious upon visit and similar fields in the surrounding area were planted, more supporting evidence will likely be required to prove the cause of loss was insured. Other supporting evidence could include soil type maps, statements from nearby producers, and statements from agricultural experts.
Typically, the US has 1-4 million prevent plant acres each year. However, a few especially large years have occurred. 2019 was by far the largest year of prevent plant with over 19 million acres. Almost double the previous high. Other high years include 2010, 2011, 2013, and 2020.
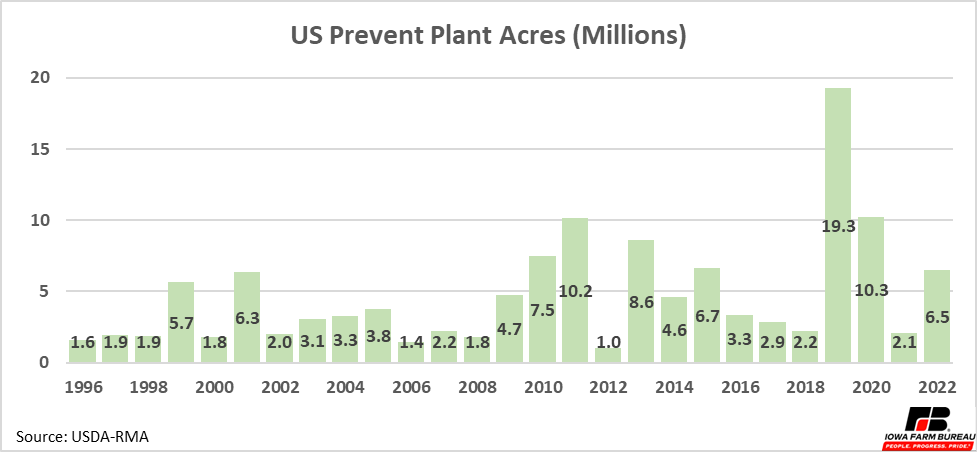
Figure 1. US Prevent Plant Acres (Millions)
Prevent plant acres are typically distributed among several states. As alluded to above, prevent-plant acres typically come in large amounts if they are all in a region. However, there are some regions that repeatedly get hit hard.
North Dakota and South Dakota make up a significant portion of total prevent plant acreage. Since shortly after prevent plant began, the Dakotas together account for over 40% of all prevent plant acres. The shorter planting window, less well-drained soils, and potentially late snow cover all contribute to higher prevent-plant acres in these states. Being farther north, the crop insurance first-planting date is later and the final planting date is earlier than most areas in the US. Furthermore, cold springs, excess rain, and late snow add to challenges farmers face getting their crops in the ground in the Dakotas.
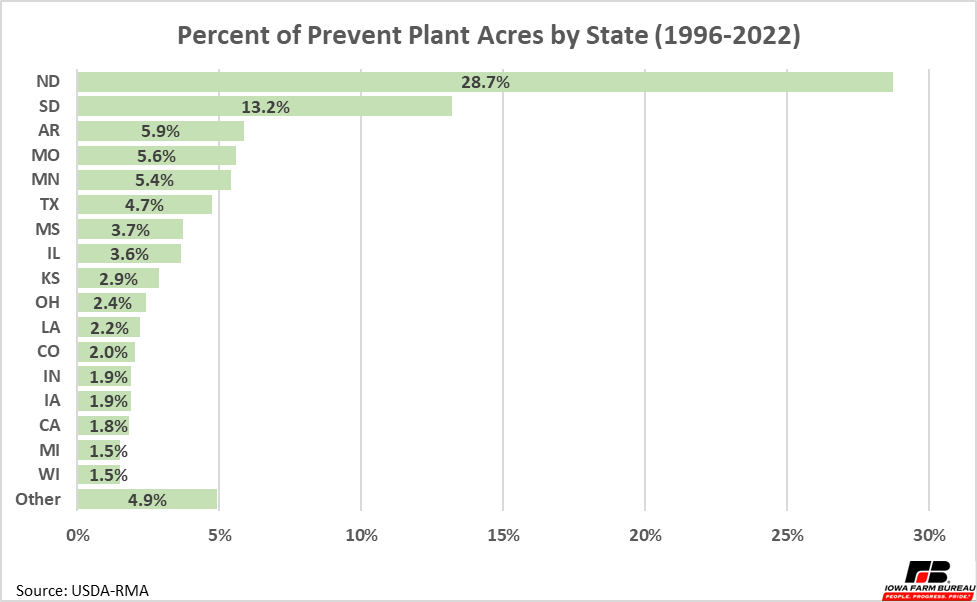
Figure 2. Percent of Prevent Plant Acres by State (1996-2022)
Relationship of Planting Progress and Prevent Plant
As mentioned above, excess moisture is by far the most common reason for prevent plant acres. It takes consistent wet conditions to cause a large number of acres to be prevented from planting. Short wet spells can delay planting but because US farmers can get the crop in the ground so fast when field conditions cooperate these delays can typically be overcome.
This year is a good example. Iowa’s corn planting progress was behind schedule during April, with cold temperatures delaying planting in many areas of the state. However, in the week between April 30 and May 7, Iowa planted 41% of its total corn acres. This is not even the largest percentage Iowa has planted in one week. In 2011, Iowa planted 61% on its corn acres in one week (Figure 3).
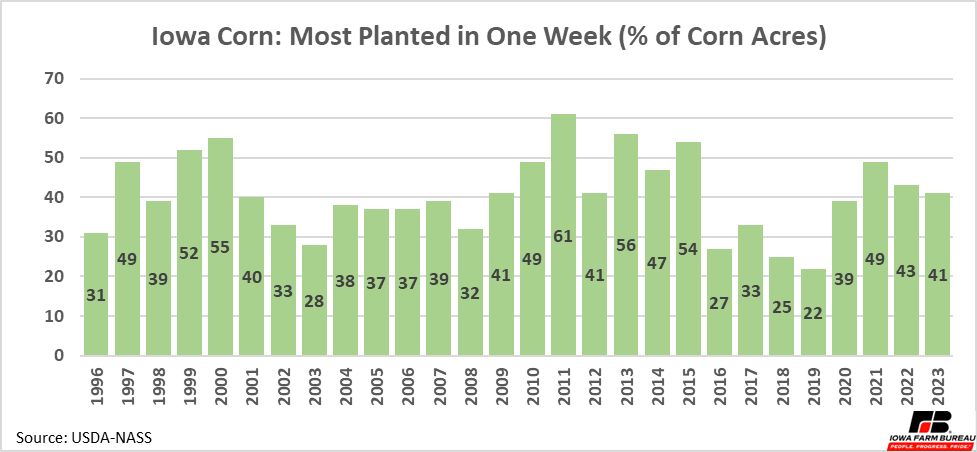
Figure 3. Iowa Corn Planting Progress: Largest Weekly Increase by Year
In general, the planting progress of the US is lower than for individual states because of the larger region the US covers. If a region in the south makes a lot of progress but planting has not yet started in the north, the US completion won’t look high, but a lot of available acres were completed. Even so, the US almost always plants 20% of its total corn crop in one week and one year (2013) planted 43% of its corn crop in one week.
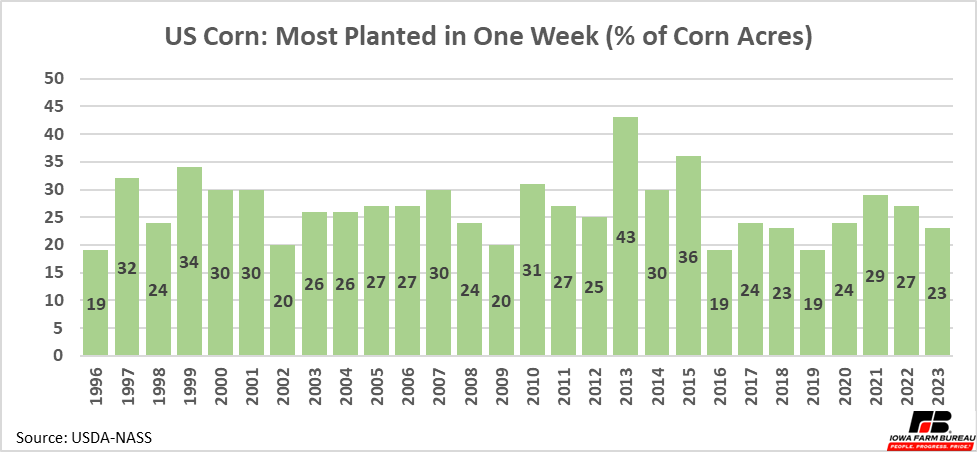
Figure 4. US Corn Planting Progress: Largest Weekly Increase by Year
Among the states, Minnesota and Ohio are tied for the largest percentage of their corn crop planted in one week at 65% (Figure 5). The “I-states” are not far behind with Iowa, Illinois, and Indiana all having weeks where at least 50% of their corn crop was planted.
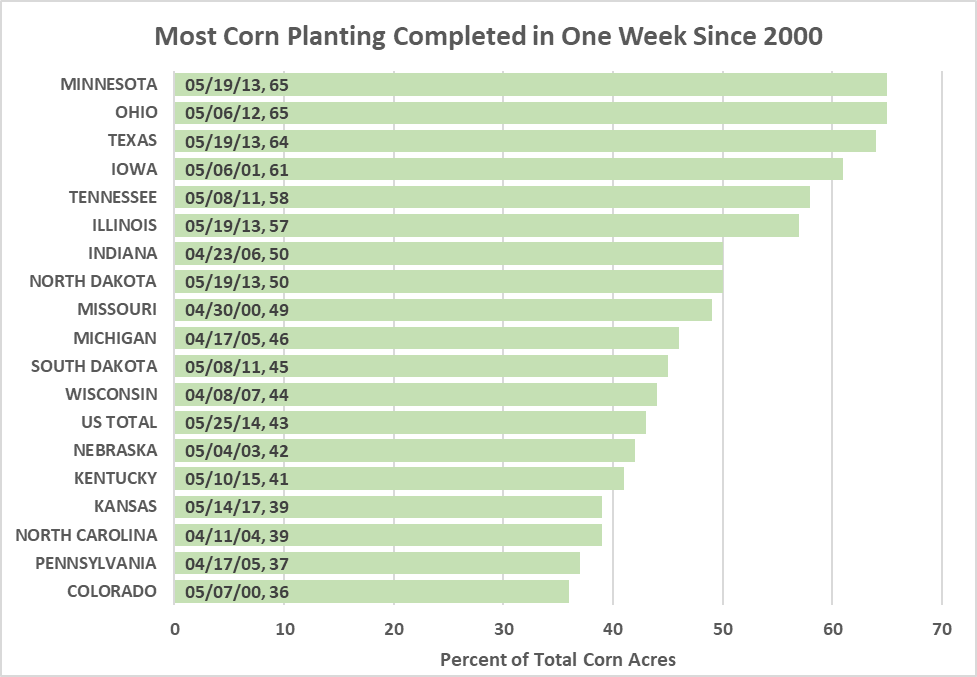
Figure 5. Most Corn Planting Completed in One Week Since 2000
Because of the US ability to get crops in the ground quickly, week to week planting progress is not a good predictor of prevent-plant acres. Figure 6 shows scatter plots of final prevent plant corn acres in relation to percent of corn planted on the 19th and 22nd weeks of the year. The 19th week of the year is around the second week of May and was the week ending on May 14 in 2023. The 22nd week is around the first week of June and will be the week ending June 4 in 2023.
The blue dots are spread out wide horizontally but are not spread out vertically. This is because in some years 50% of corn is in the ground and in other years around 80%, but in both cases, total prevent plant corn acres ends below 2 million acres. There are a lot of pathways to 2 million acres of prevent plant corn.
The orange dots are closer to the trendline than the blue dots, but there is still noticeable variation. One orange dot is an outlier that occurred in 2019 when consistent wet weather delayed planting and led to a record number of prevent plant acres. This outlier helps makes planting progress trendline look better, but it still is not a great predictor. Furthermore, this is in early June, when planting is close to over and predicting prevent plant acres off planting progress is less important.
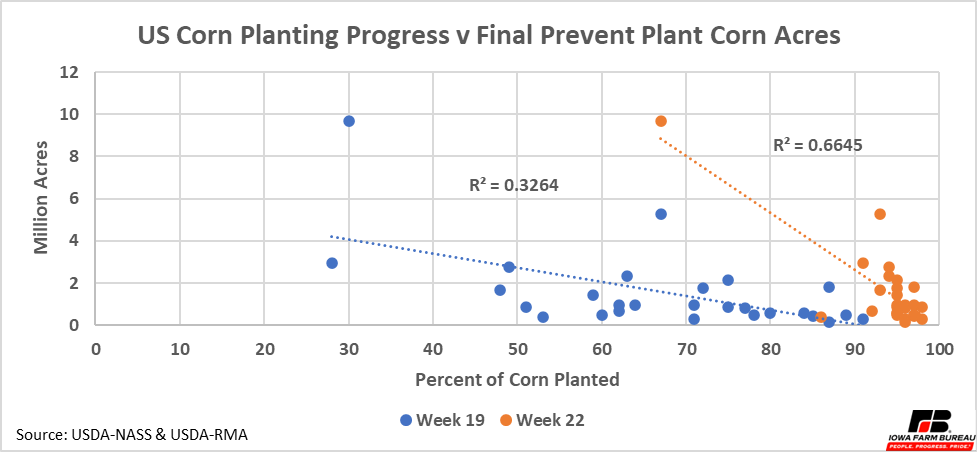
Figure 6. US Corn Planting Progress v Final Prevent Plant Corn Acres
We can quantify the predictive power of planting progress using the R-squared value.
The R-squared value measures how much the variation in one variable can be used to predict the variation in another variable. To help illustrate what R-squared measures, Figure 6 notes the R-squared values for both series. Week 2022 has a higher r-squared value and the dots are closer to the trendline.
The R-squared between US corn planting progress and US corn final prevent plant acres was calculated for each week planting progress reports were released. Years included were 1996-2022. Notice the R-squared value, blue bars in Figure 7, increase throughout the planting season except for an unexpected decrease at the end. This means planting progress becomes a better explanation of prevent-plant acres as the season progresses. The orange bars in Figure 7 are the R-squared values if the outlier year of 2019 is removed. As alluded to earlier, removing this outlier significantly lowers the R-squared value.
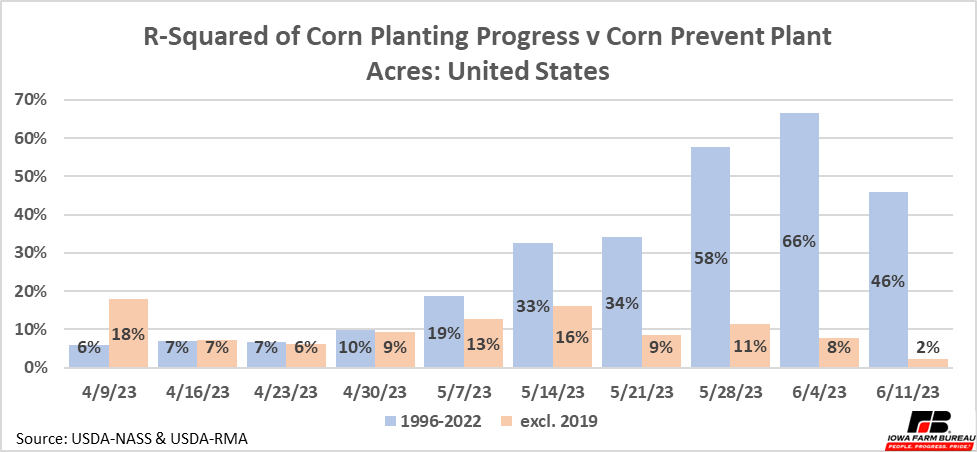
Figure 7. R-Squared of Corn Planting Progress v Corn Prevent Plant Acres: United States
As mentioned earlier, North Dakota and South Dakota battle a short planting window every year and historically have had more prevent plant acres than other areas. These also get their crop in the ground if they can. They have planted 50% and 45% of their corn crop in one week before, respectively (Figure 5).
Figure 8 and Figure 9 show the R-squared values of North Dakota and South Dakota, the same way that Figure 7 showed R-squared values for the United States. The South Dakota graph is very similar to Figure 7. The R-squared value increasing throughout the year and removing the 2019 outlier significantly reduces the R-squared value. North Dakota is different for a couple reasons. First, planting progress for corn was tracked starting in 2000 and is not available before then. Furthermore, the largest prevent plant outlier for North Dakota is 2020 not 2019. Removing 2020, does not significantly reduce the R-squared. This is because North Dakota has several high prevent plant years and taking away one of many large values does not move things as much as taking away the only large value. Still, the R-squared increases throughout the planting season and becomes most reliable in late May. Late May is also the cut off for corn planting in North Dakota and South Dakota, so again not a lot of forecasting power is available in the data.
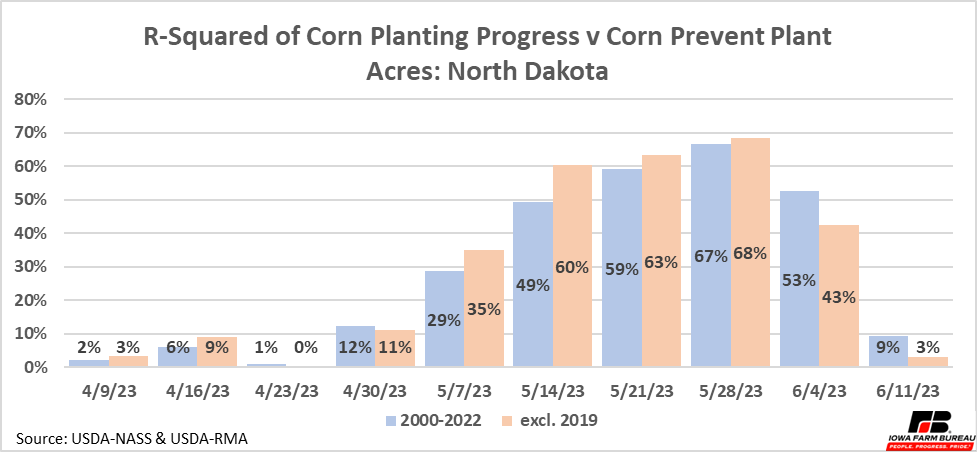
Figure 8. R-Squared of Corn Planting Progress v Corn Prevent Plant Acres: North Dakota
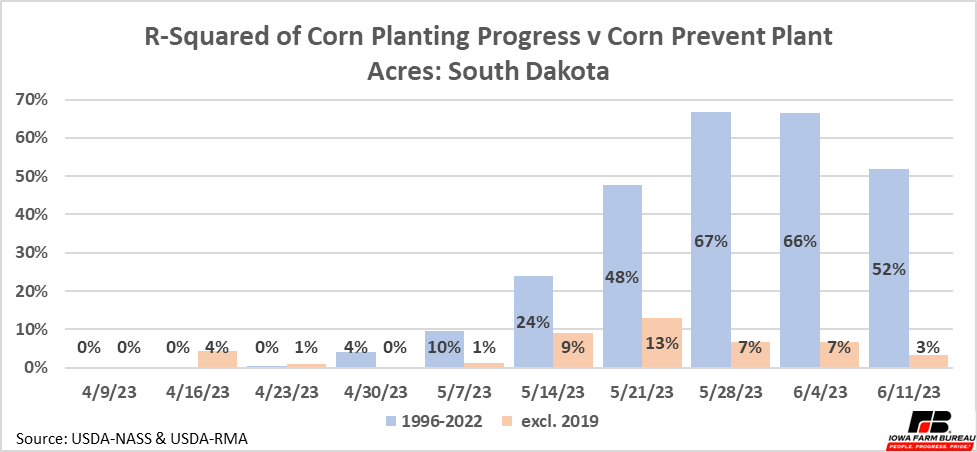
Figure 9. R-Squared of Corn Planting Progress v Corn Prevent Plant Acres: South Dakota
Takeaways
Prevent-plant payments provide protection against the risk of weather preventing a field from being planted. Prevent-plant acres typically total between 1-4 million acres but have had a few very high years mixed in, as well. The Dakotas almost always have the most total prevent plant acres. A comparison of corn planting progress to corn prevent-plant acres shows that slow progress early in the year is a poor predictor of prevent-plant acres. This is because the US can plant fast and make up for lost time relatively easily.
Want more news on this topic? Farm Bureau members may subscribe for a free email news service, featuring the farm and rural topics that interest them most!