May 2018 Growing Degree Days, Precipitation & Drought Monitor
Published
5/31/2018
The second graph shows a comparison of GDD for a few years between 2012 and 2018 at various locations. As you can see, the 2018 Iowa average GDD totals were behind the other years early on, but have recently caught back up to pace with other recent years such as 2017, 2016, and 2014. Most locations shown are now at a cumulative GDD similar to the past few years since recent temperatures have been extremely warm to make up for the cool April.
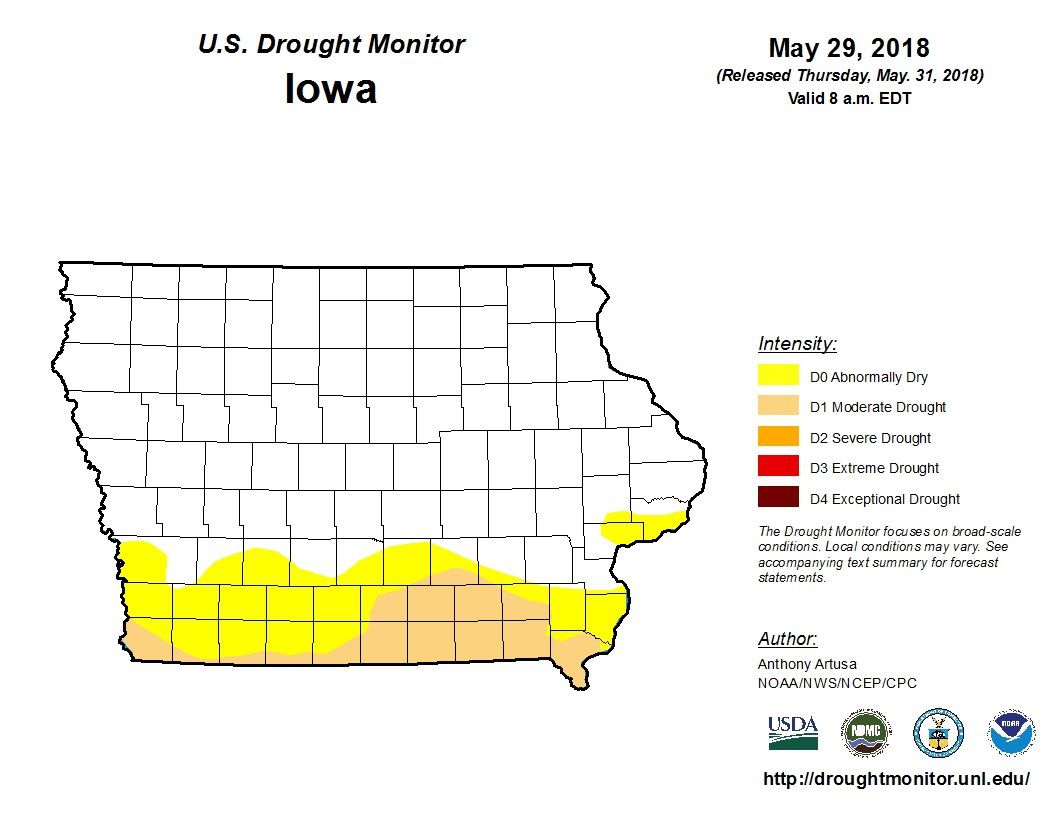
The map below shows the cumulative precipitation beginning in April for several locations across the state. Charles City and Des Moines currently have the highest totals out of these locations, while Red Oak is estimated to have the least cumulative rainfall since April 1, 2018. As you can see, several of these locations went from the middle of May until the end of May without many significant rainfall events, so the scattered showers across the state this week were much needed in many locations. The current drought monitor for Iowa is also shown below – as you can see, much of the bottom third of the state is either abnormally dry or suffering from a moderate drought as of May 29th.
Michelle Mensing, Research Analyst, Decision Innovation Solutions (DIS). DIS is an Iowa-based economic research firm which provides regular farm economic research for Iowa Farm Bureau staff & members.
Want more news on this topic? Farm Bureau members may subscribe for a free email news service, featuring the farm and rural topics that interest them most!