Iowa Grain Buyers and Corn and Soybean Basis
Author
Published
3/1/2023
There are roughly 580 grain buyers in Iowa who post their daily bids on-line (on their own websites and/or on other grain marketing news and information websites). This map represents where those grain buyers are and the type of firm that they are. The majority of the grain buyers are elevators that provide markets for both corn and soybeans – it should be noted that many elevators also have an associated feed mill, but for this graphic, places that are just a feed mill are highlighted differently than elevators. There are 42 ethanol plants in the state and several large corn processors that just buy corn (as well as a few feed mills). There are 17 active soybean crush facilities that buy just soybeans.
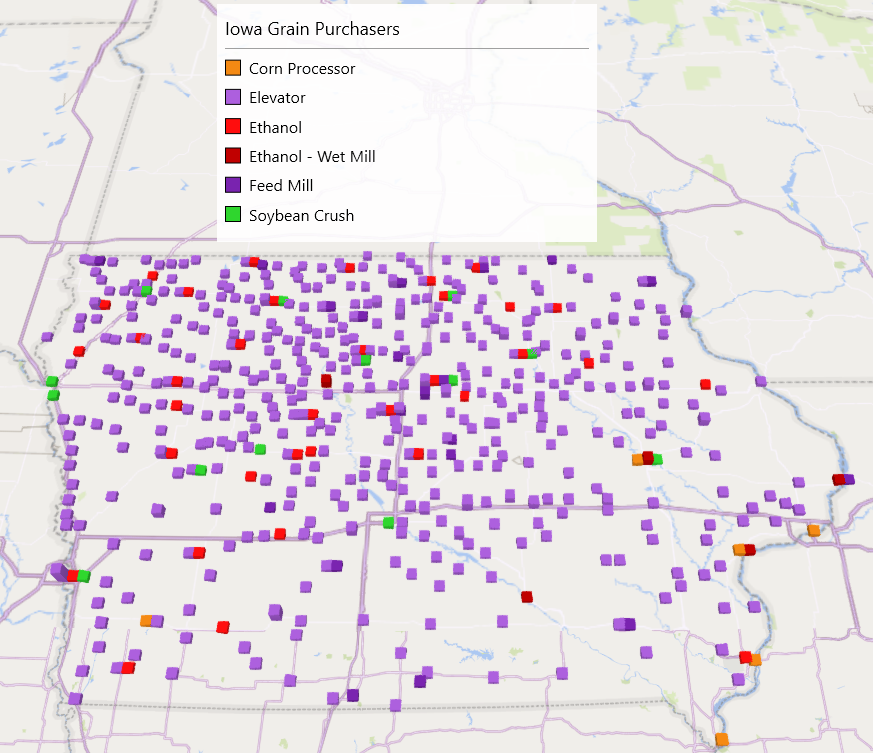
Figure 1. Iowa Grain Buyers
Corn Basis
Corn Basis is the difference between the local cash price and the nearby futures contract price, and accounts for changes in the supply and demand in local markets relative to the reference price market. Basis tends to be the weakest (most negative or less positive) just after harvest (as local supply is at its largest), and then tends to improve (or strengthen) as the marketing year advances (while crop demands work through the supply). Differentials among basis at various demand points can stimulate (or discourage) movement of product from one location to another.
Basis levels tend to strengthen as the distance to demand centers is lessened. In the case of Iowa, historically that meant that the basis levels in the eastern part of the state tended to be higher than those for the northern and western part of the state due to near proximity to the export terminals in the Gulf. But as large interior demand points (ethanol plants) were developed basis patterns changed and northcentral and northwestern Iowa became the better basis markets and southcentral Iowa which has no ethanol plants became the weakest basis area.
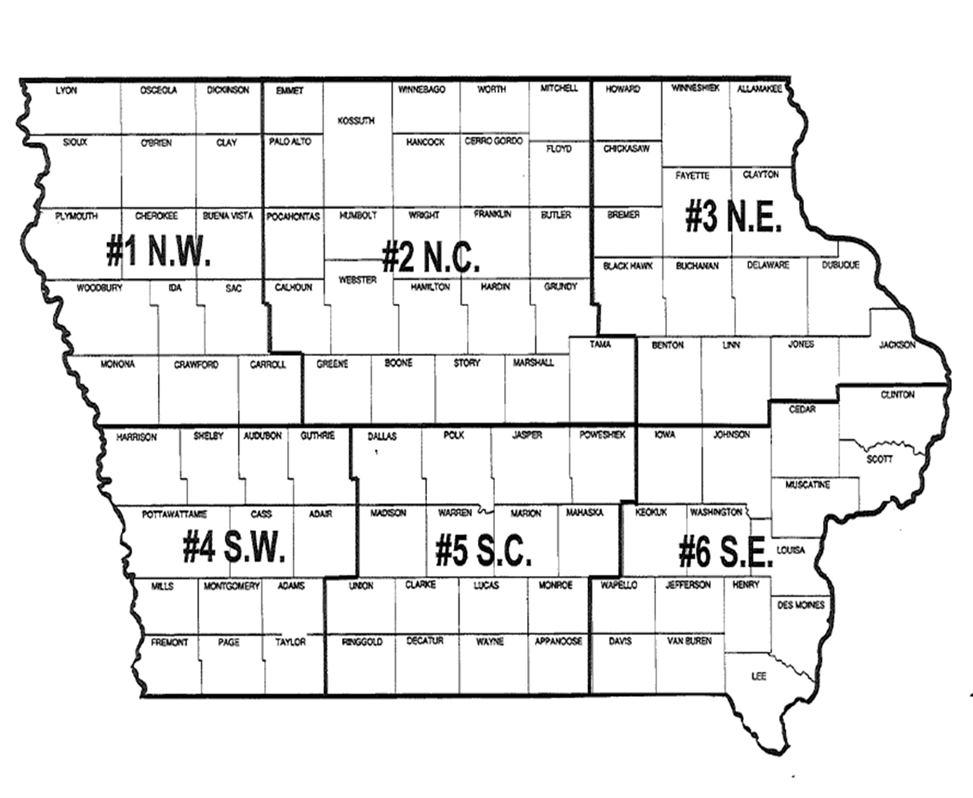
Figure 2. Iowa Basis Districts
The ethanol surge began in 2007, and as production grew over the next 5 years, corn basis overall improved in the Corn Belt (a rising tide truly does lift all boats). Expanded local corn demand for ethanol production promoted higher local prices, and therefore, improved the basis. For Iowa, corn basis strengthen overall during the 2007 to 2012 ethanol expansion period. Basis levels retreated quite a bit during the slump in corn prices 2014-2019 and during the trade war with China but have strengthened substantially since Russia invaded Ukraine with accompanying disruptions in corn supplies from the Black Sea area (Figure 2).
Compared to the 2005 – 2007 marketing years, statewide corn basis strengthened 15 cents in the period of ethanol expansion (2008 – 2011). Basis weakened during the slump in corn prices of 2015 – 2018 due to slowing growth in ethanol production, relatively good weather in all the major global growing areas and increased trade disruptions. And in the most recent period, basis has strengthened substantially with statewide basis 45 cents per bushel better than the pre-ethanol period and northwest Iowa 52 cents per bushel higher than pre-ethanol and northcentral Iowa 48 cents per bushel better than pre-ethanol levels. Southcentral and southeastern Iowa basis levels during the most recent 3-year period are better than pre-ethanol, but the weakness in exports has muted the impact in southeastern Iowa and the lack of ethanol production in southcentral Iowa has limited the basis gains there.
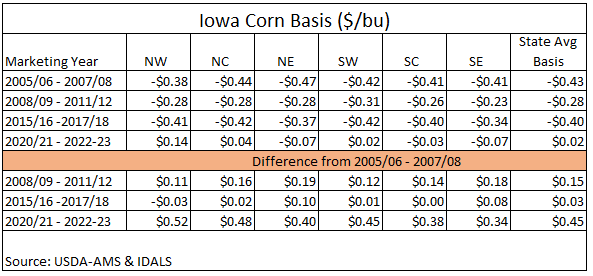
Figure 3. Iowa Corn Basis (Three-year averages)
Regional Corn Basis Compared to the State Basis
Over the past 20 years there have been shifts in how regional basis compares to statewide basis levels for corn. Basis levels in Northwest Iowa and Northcentral Iowa have strengthened versus the statewide basis. Southwest Iowa basis has a flat trend compared to the statewide basis. Northeast Iowa, Southcentral Iowa and Southeast Iowa have negative trends compared to the statewide basis.
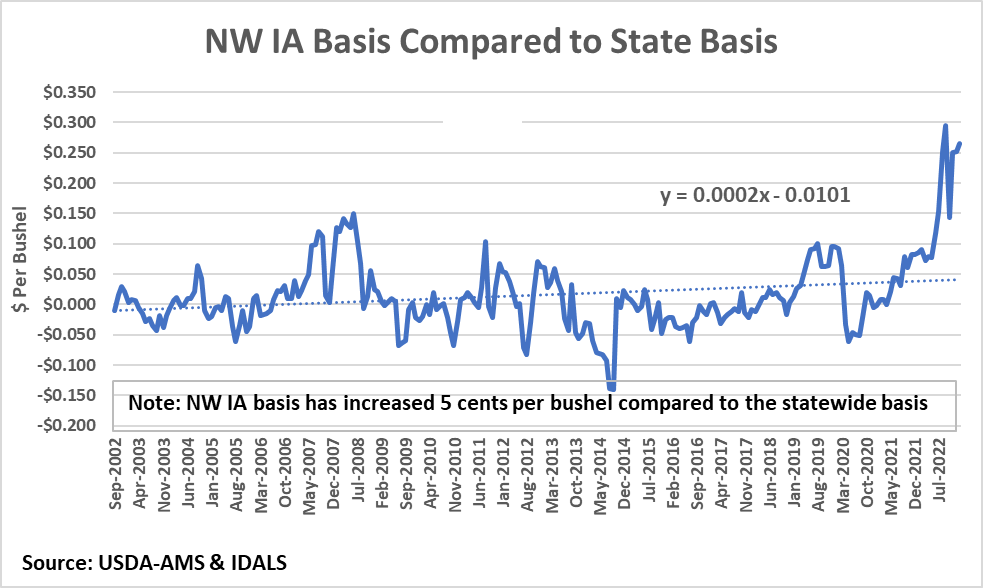
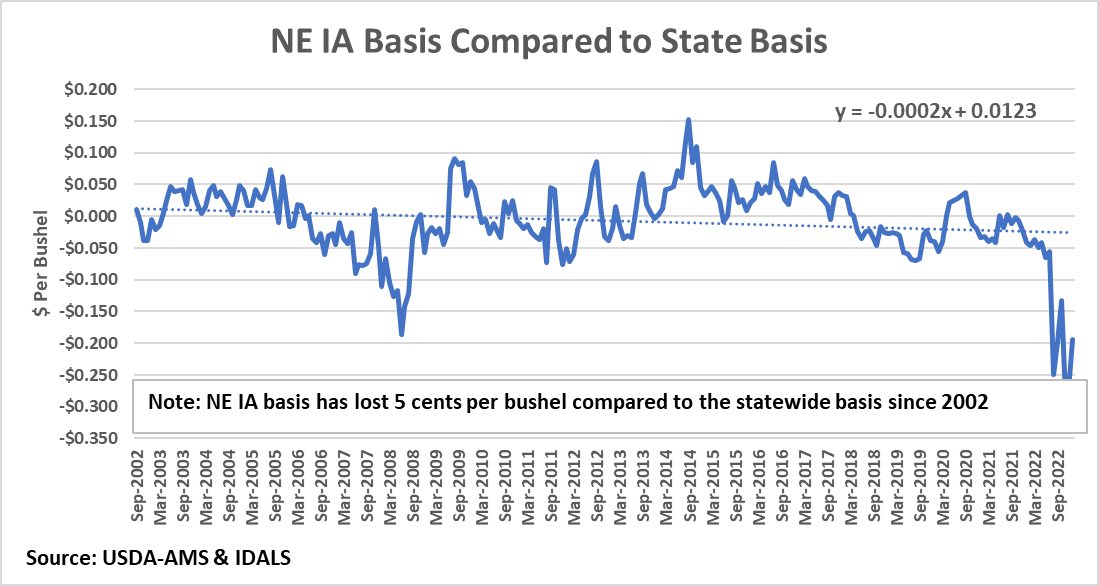
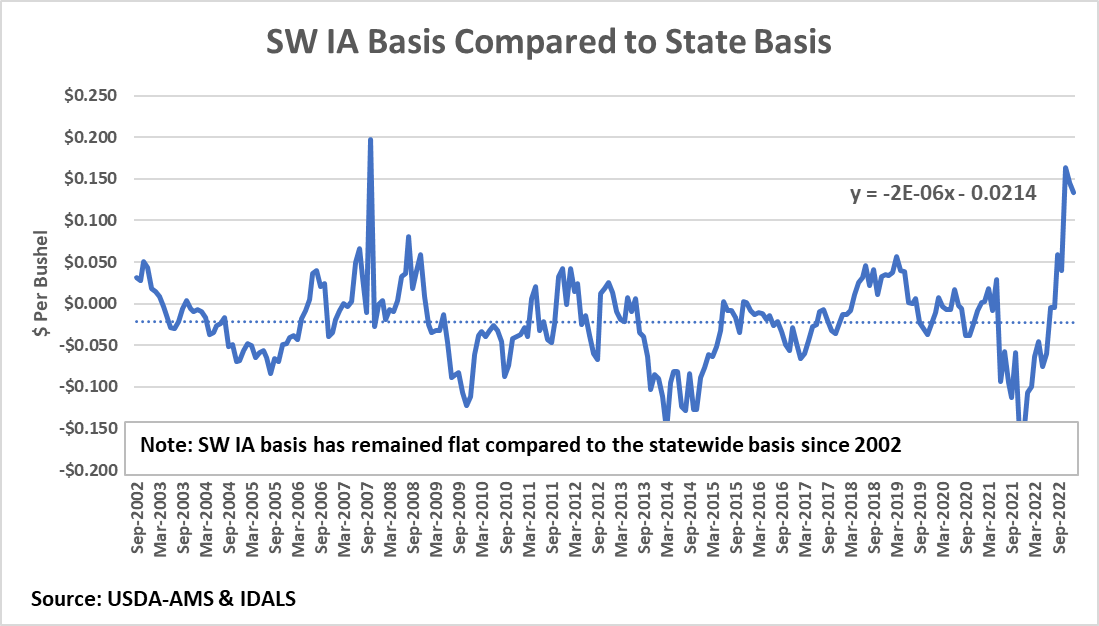

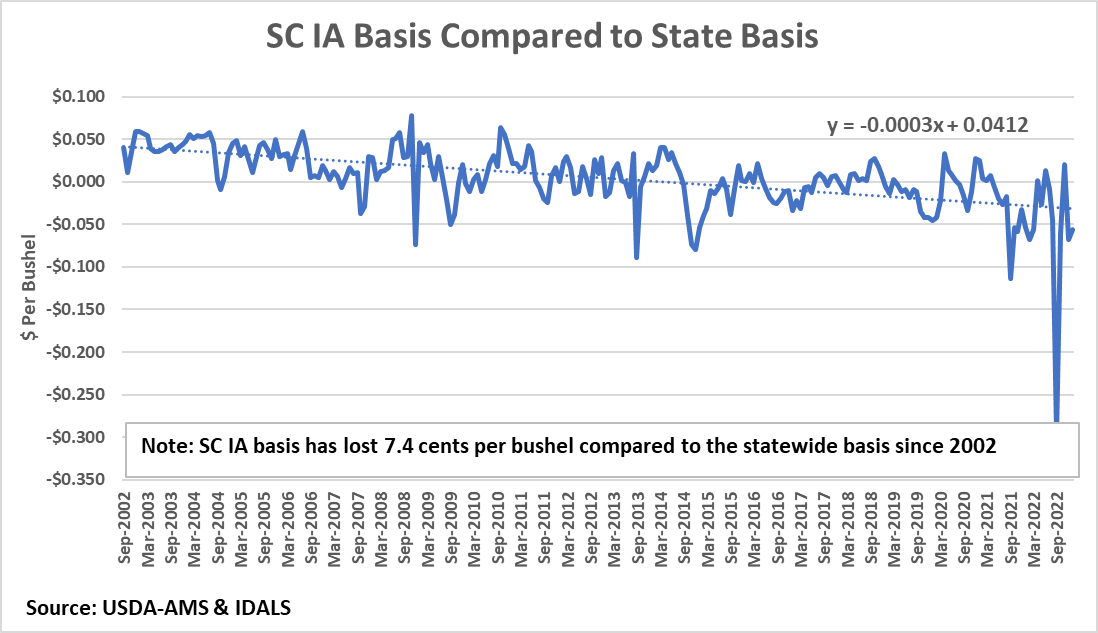
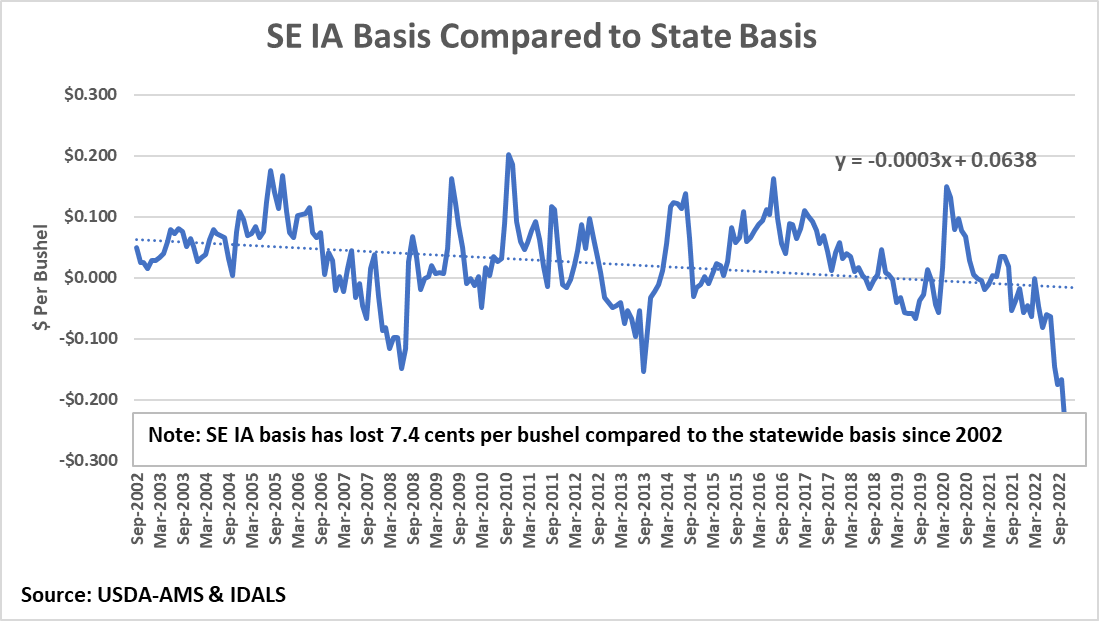
Figure 4 shows the corn basis for elevators and ethanol plants within a 250 mile radius of Fort Dodge, IA.
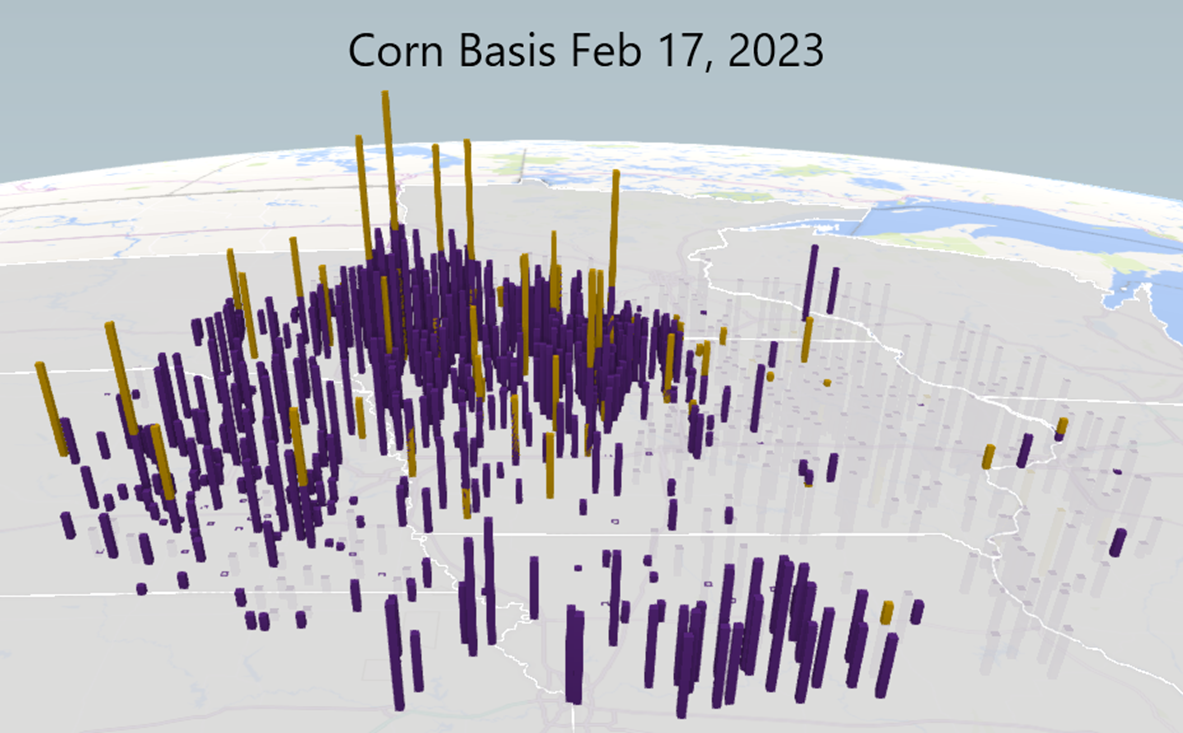
Figure 4. Corn Basis Feb 17, 2023
Basis levels in northwest Iowa and Northcentral Iowa are significantly positive, whereas corn basis levels in eastern Iowa and the western portions of Illinois and Wisconsin are negative. Also shown in Figure 4 is the premium (better basis) that, in general, is occurring at ethanol plants across Iowa, Nebraska and Minnesota. Figure 5 shows the advantage (better basis) that corn bids from ethanol plants exhibit when compared to the Iowa regional basis averages. Statewide, it is a 9.5 cent per bushel premium (Table 1).
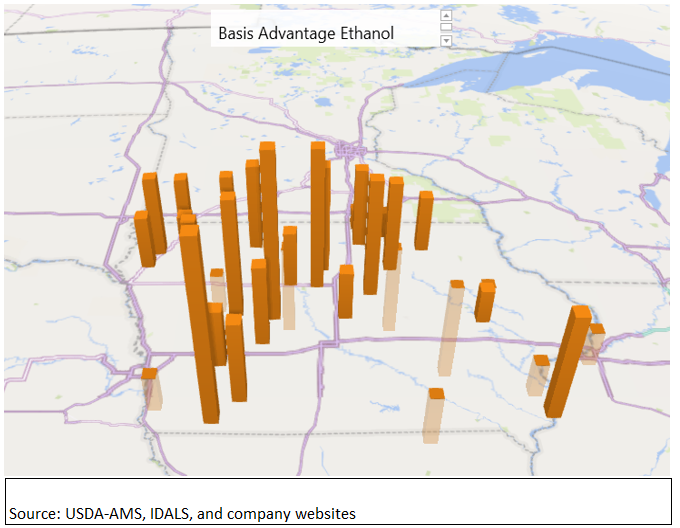
Figure 5. Corn Basis Advantage from Ethanol
Table 1. Iowa Ethanol Plant Basis Difference Compared to Regional Average Basis
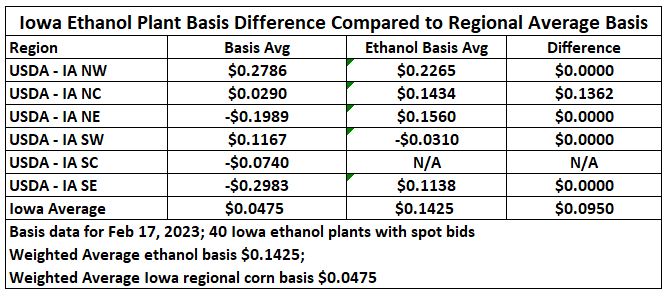
If ethanol plant corn bids are compared to the statewide average, the premium paid at ethanol plants is 16 cents per bushel greater than the statewide average corn bid.
Iowa Soybean Basis
Figure 6 shows monthly regional Iowa soybean basis levels from 2002-03 through the present time. Soybean basis levels have been quite volatile over the past 20 years ranging from near zero (2012-13) to more than 90 cents under the Chicago Board prices in 2007-08 and again in 2018-19. Regionally, the Southeast Iowa basis has historically been the strongest basis for soybeans in Iowa. This reflects the strong export demand for soybeans through the Mississippi River and Louisiana Gulf ports. More recently, however, the high barge rates on the Mississippi River have put pressure on basis levels along the Mississippi River and that is reflected in the weaker basis bids of both Northeastern Iowa and Southeastern Iowa.
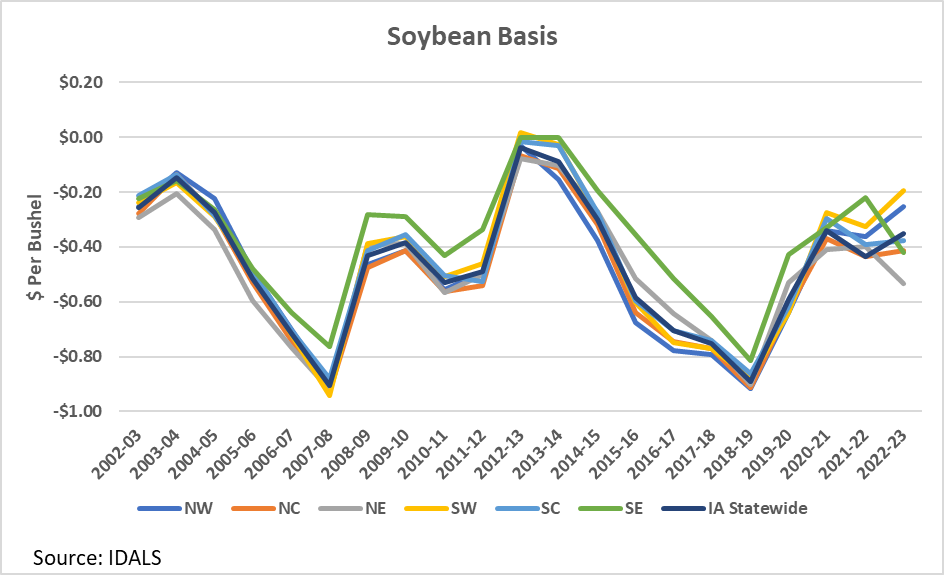
Figure 6. Iowa Soybean Basis
Statewide and Regional Basis Patterns
Statewide the soybean basis in Iowa has weakened by 14.7 cents/bu since 2002.
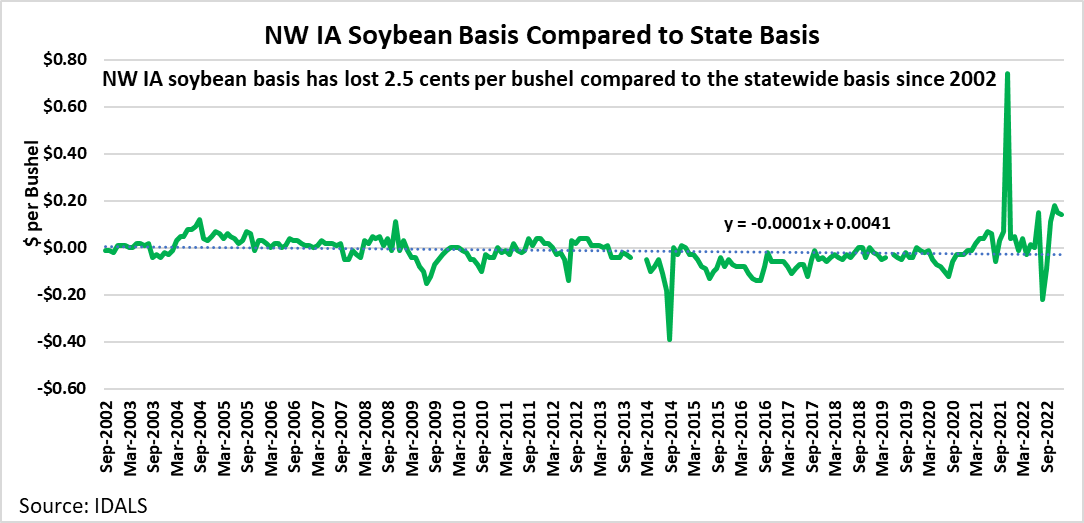
Northwest Iowa soybean basis has lost 2.5 cents/bu compared to the statewide basis since 2002.
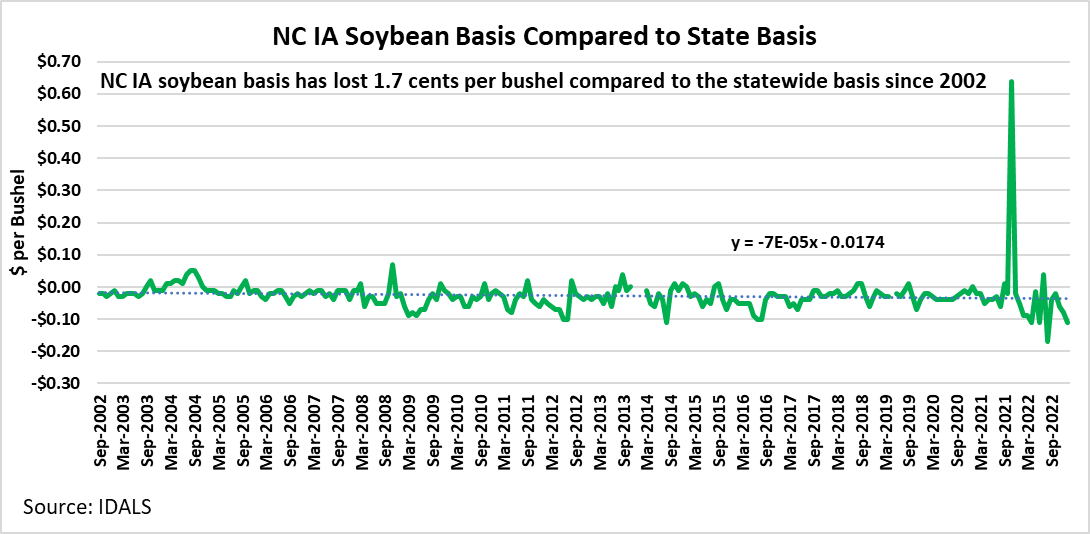
Northcentral Iowa soybean basis has lost 1.7 cents/bu compared to the statewide basis since 2002.
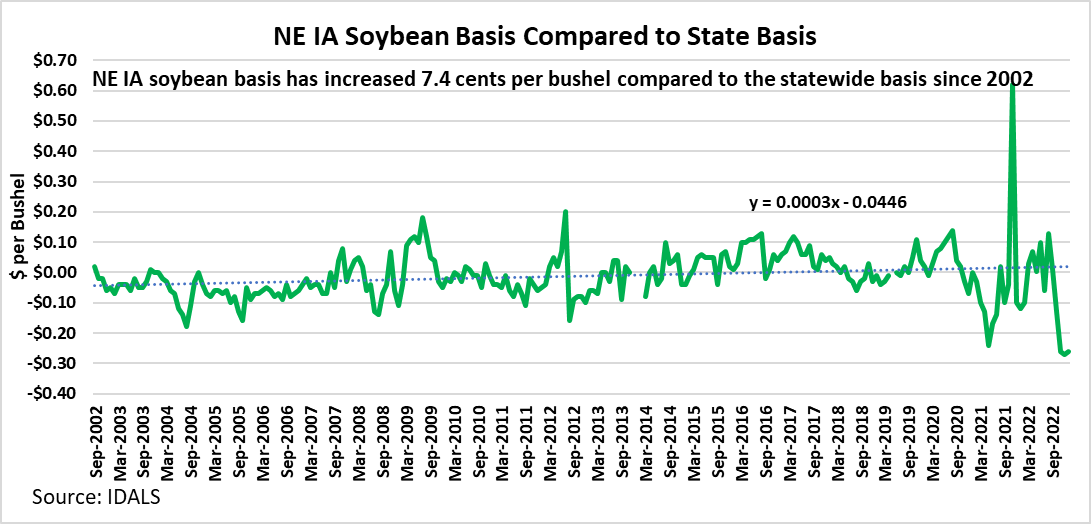
Northeast Iowa soybean basis has increased 7.4 cents/bu compared to the statewide basis since 2002.
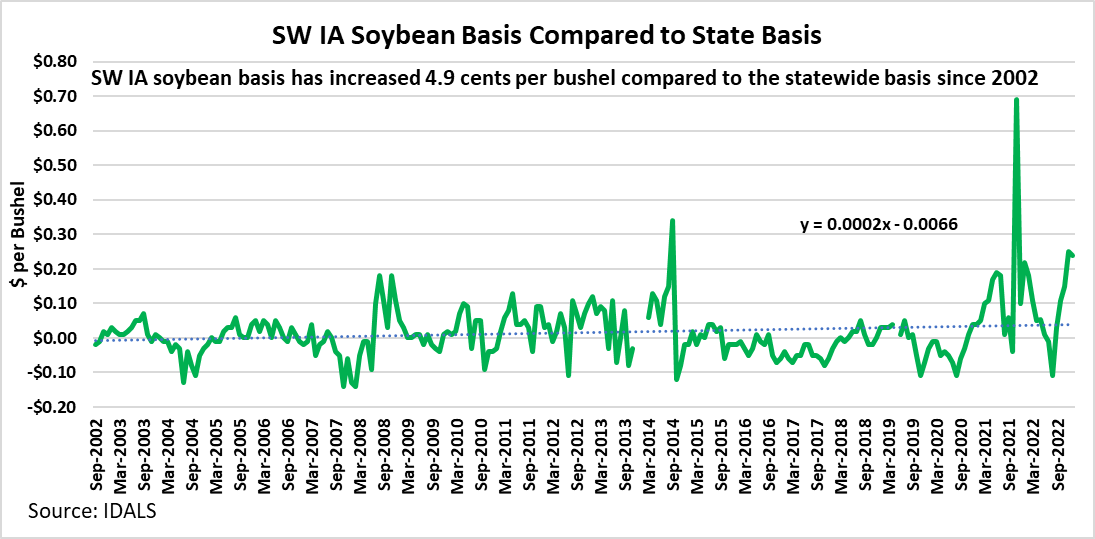
Southwest Iowa soybean basis has increased 4.9 cents/bu compared to the statewide basis since 2002.
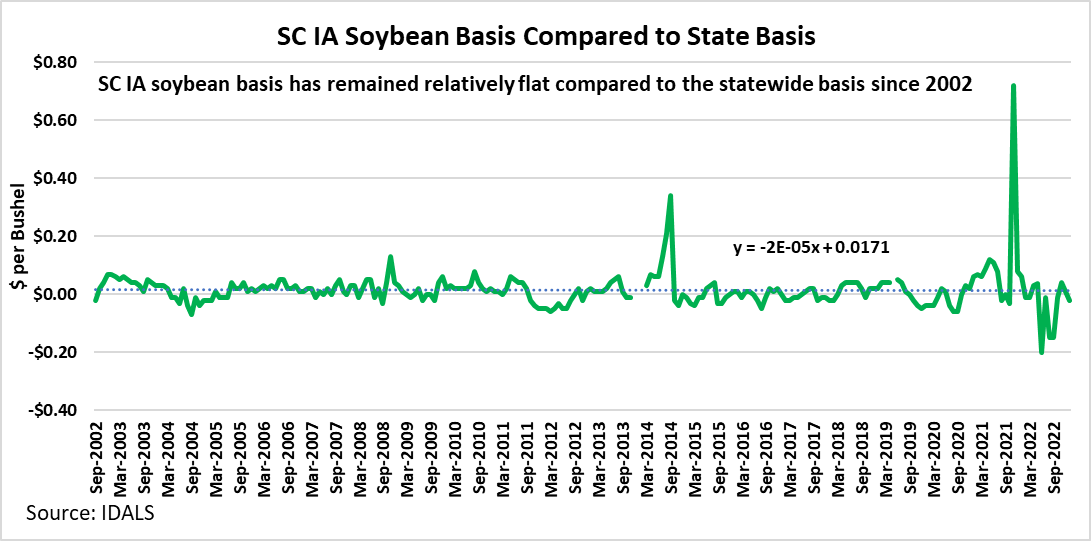
Southcentral Iowa soybean basis has remained flat compared to the statewide basis since 2002.
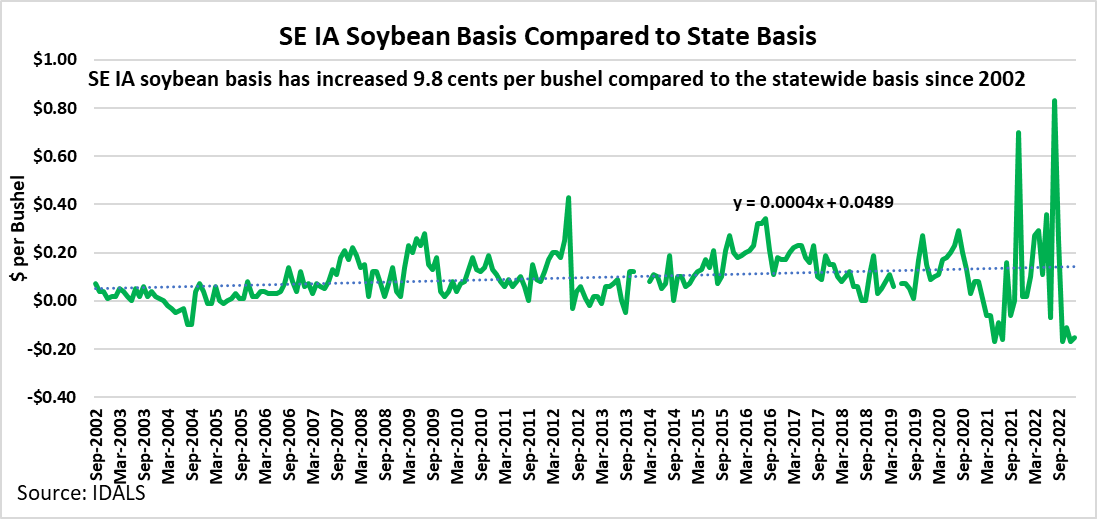
Southeast Iowa soybean basis has increased 9.8 cents/bu compared to the statewide basis since 2002.
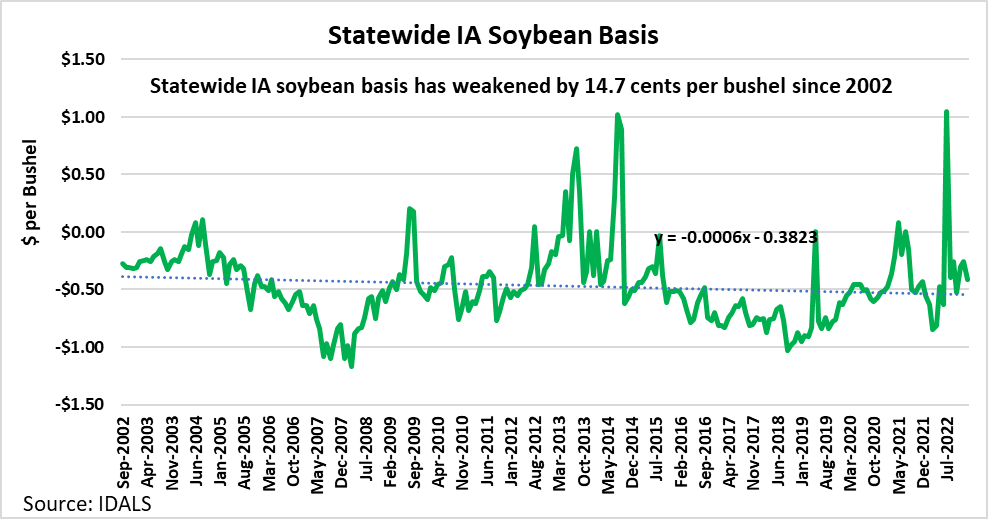
Figure 7. Statewide IA Soybean Basis
Iowa has soybean processing plants in the 14 counties within the state. Nine of the plants are relatively large processing plants with more than 100 thousand bushels per day of processing capacity. Five of the plants are mid-sized plants with 60 to 100 thousand bushels per day of processing capacity and 4 of the plants are smaller plants that tend to do specialty soybean processing. (Figure 7)
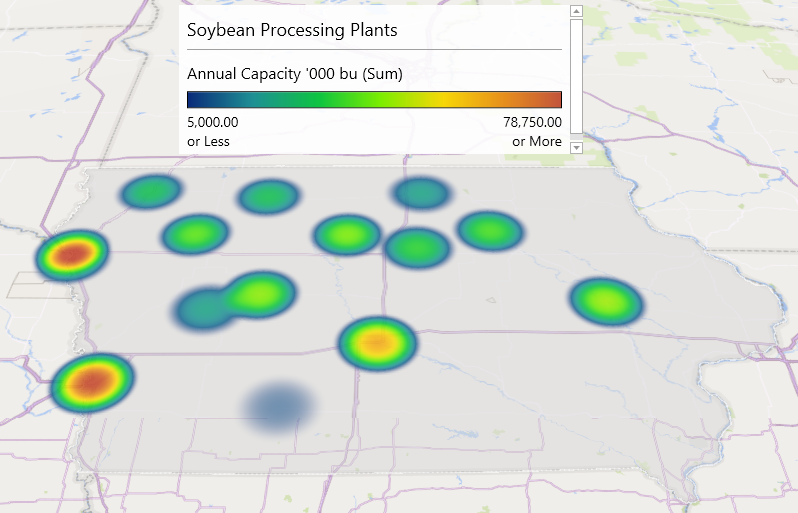
Figure 8. Soybean Processing Plants
Iowa has active biodiesel production in 10 counties (Figure 9) with production ranging from 6.8 million gallons per year to more than 52 million gallons per year.
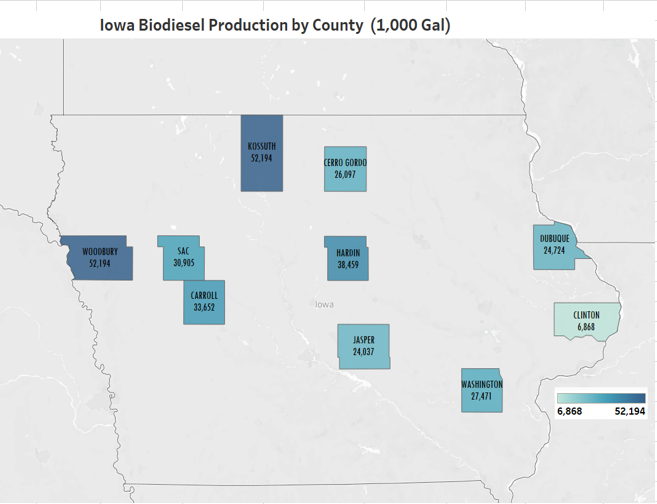
Figure 9. Iowa Biodiesel Production by County
Economic analysis provided by David Miller, Consulting Chief Economist, Decision Innovation Solutions on behalf of Iowa Farm Bureau.
Want more news on this topic? Farm Bureau members may subscribe for a free email news service, featuring the farm and rural topics that interest them most!