Iowa Corn and Soybean Basis Maps and Trends
Author
Published
5/24/2018
Iowa Corn and Soybean Basis Maps
Basis (cash price minus futures price) varies across Iowa. Below are a snapshot maps of corn and soybean basis levels for the date indicated. These maps are generated using almost 1,400 crop buying locations (elevators, processors, etc.).
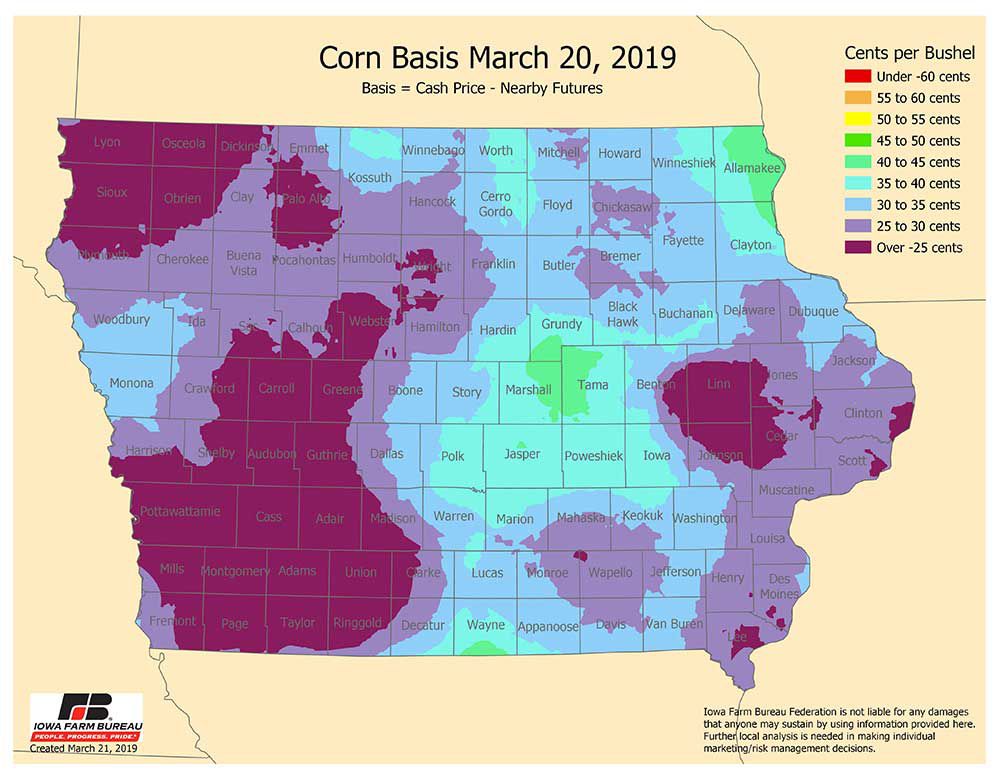
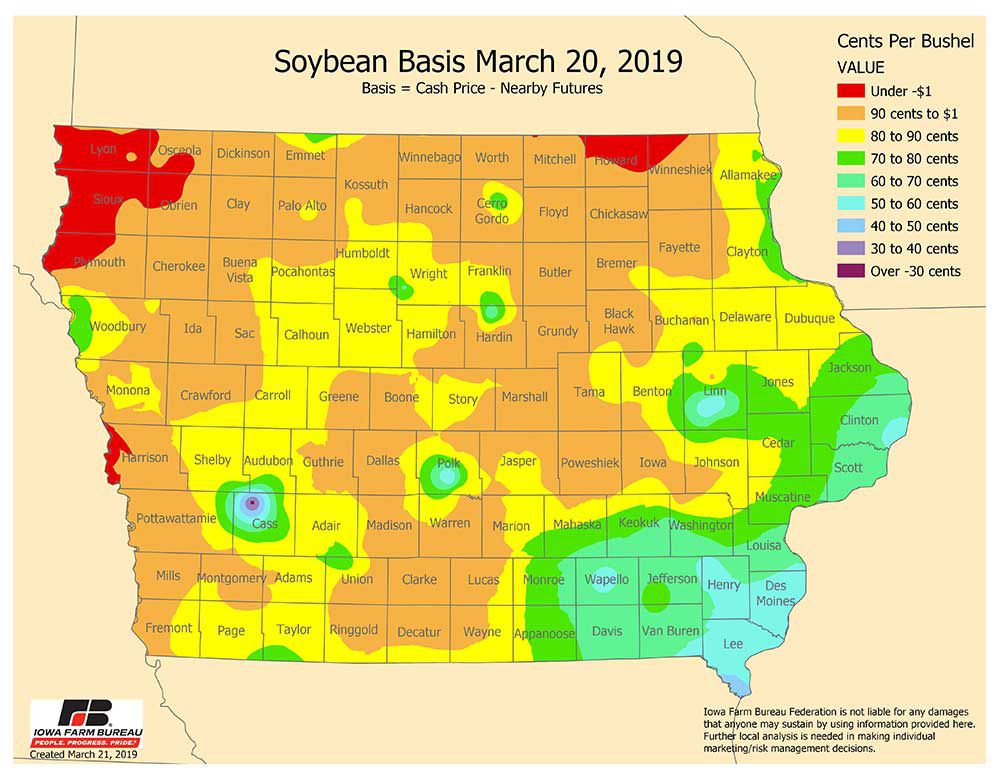
The color legend shows the various basis levels in Iowa. This make it easy to see the comparative basis levels on that date.
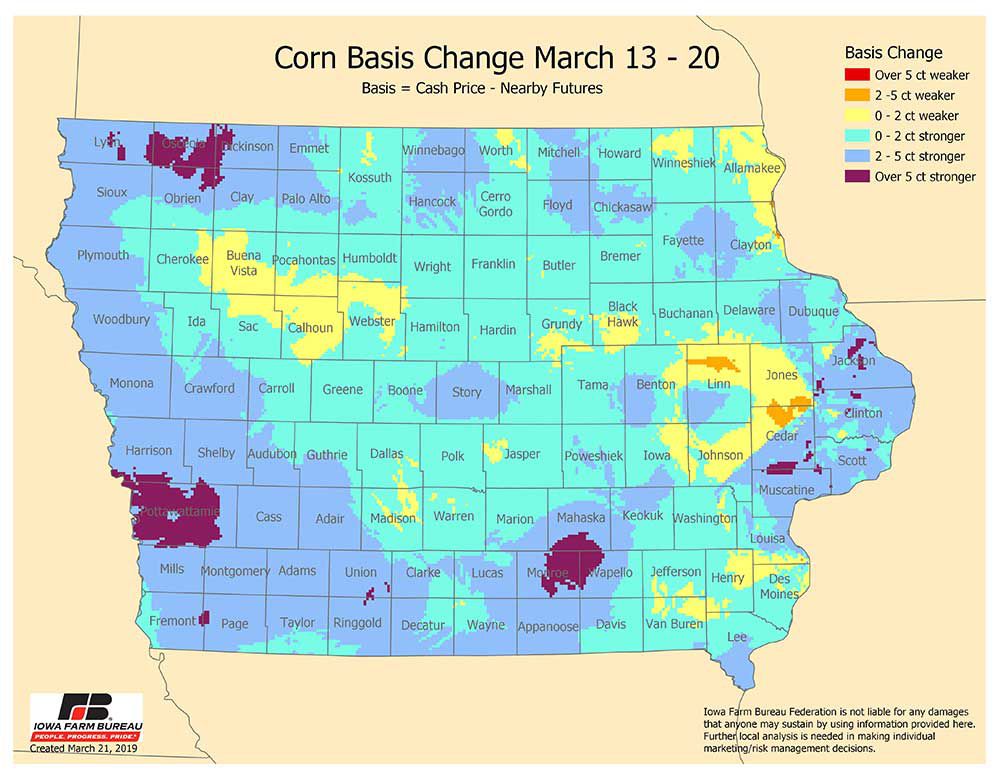
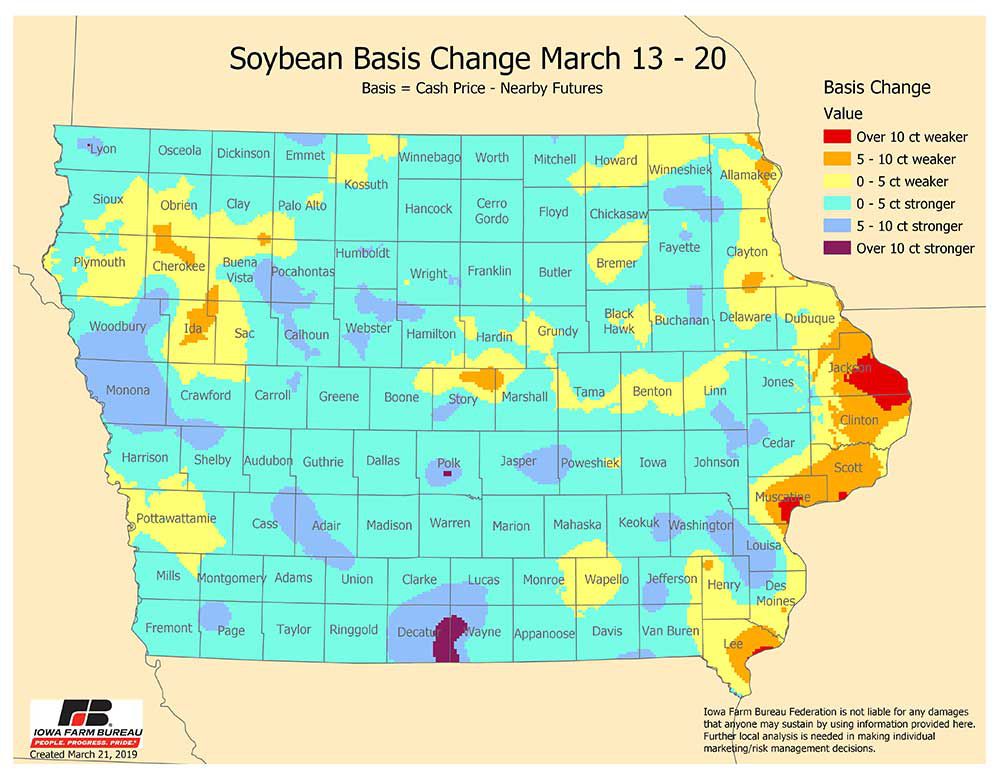
Basis Change from Previous Week
The maps below show the change (deviation) in corn and soybean basis from the previous week. These maps can be used to view the recent basis trend in areas of the state.
Want more news on this topic? Farm Bureau members may subscribe for a free email news service, featuring the farm and rural topics that interest them most!