Hog Prices Falling, Weaker Demand to Blame
Author
Published
5/22/2023
Prices Dropping
Lean hog futures prices have been trending down for some time. The nearby price has been trending down since last summer (Figure 1). The down trend is more obvious in individual contracts (Figure 2). Every futures contract lost significant ground in March. Most have not fared that well in May either.
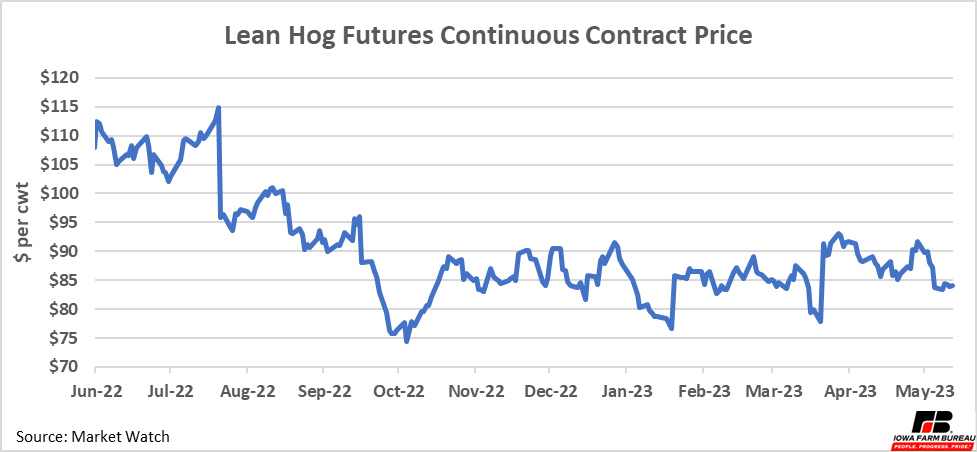
Figure 1. Lean Hog Futures Continuous Contract Price
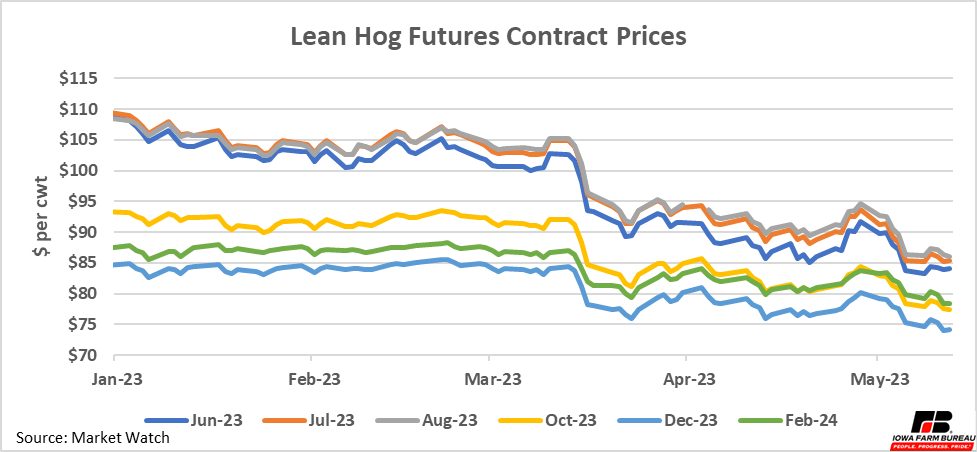
Figure 2. Lean Hog Futures Contact Prices
Pork Cutout
The drop in futures prices has followed a drop in the pork cutout value (Figure 3). After sitting over $100 per hundredweight for large parts of both 2021 and 2022, the cutout value has lost ground in 2023.
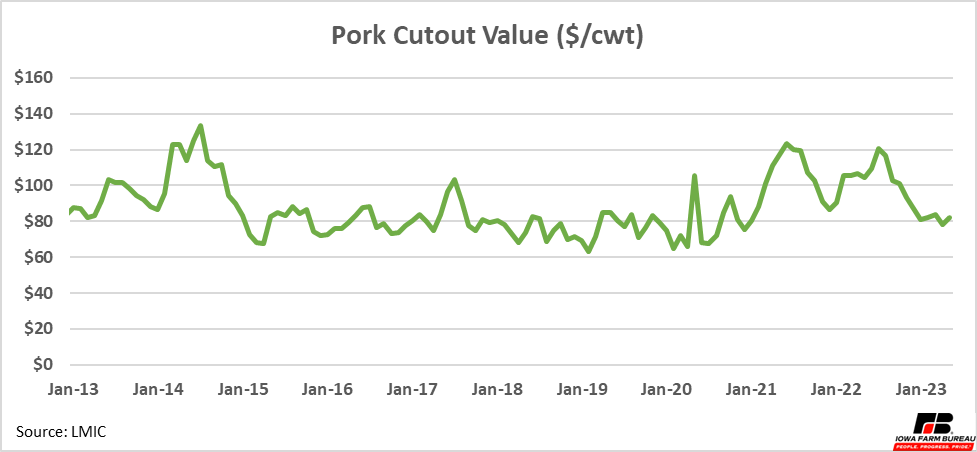
Figure 3. Pork Cutout Value ($/cwt)
Looking at individual cuts can help further pin down why prices are changing. Figure 4 shows the prices for the major primal cuts of pork. The belly and rib are bolded as they have come down significantly in price since 2022.
The rib only makes up about 5% of total meat from the cutout, but the belly makes up about 16%. This means that large changes in the price of the belly can more easily influence the price of the total cutout. The belly is primarily used to make bacon. Bacon prices are also declining at the retail level, down 8.9% in April year-over year.
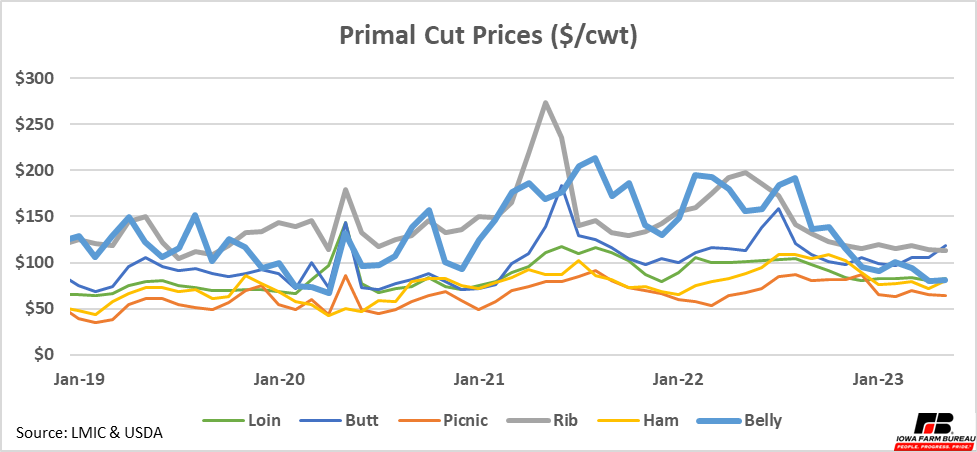
Figure 4. Primal Cut Prices ($/cwt)
Demand Factors
Hog prices and the cutout value have both decreased relative to last year. Hog and pork supply have not had any drastic changes year-over-year and the quantity supplied year-over-year has been consistent on both a nominal or per capita basis. This drop in pork prices is associated with a change in demand.
Keep in mind demand is measured by price and quantity relationships, demand is the relationship between quantity purchased and the price at which those purchases are made. To illustrate changes in pork demand, Figure 5 plots the real (inflation adjusted) price of hogs against pork production per capita. 2023 is not yet complete, so forecast production and year to date average prices are used. This point could move by the end of the year.
Any point both higher and to the right of another point represents higher demand. Any point lower and to the left of another point represent lower demand. Points in the other directions cannot be known with certainty because we do not know the exact shape of the demand curves. Hypothetical demand curves are drawn in the graph in blue to help interpret these other points. These lines need to slope down from left to right but other than that could be any shape. Assuming the blues lines are a fair measure of demand over time, points on or near the curves represent stable demand, just different price and quantity relationships. Points further to the right of a particular line represent years with higher demand. For example, 2014 was a year with higher pork demand than 2011 or 2012 (higher quantity demanded at higher prices. And 2018 was a year of lower demand than 2021 or 2022, less quantity demanded at lower prices. Whereas demand in 2008, 2009, 2010, 2011, 2012, 2013, 2015, 2016, 2017, 2018 and 2020 all have similar “demand” just variation in the price-quantity relationships, but all along the same demand curve.
Notice 2023 looks to have lower demand than previous years of 2021-2022. It is both lower and to the left of 2021-2022 so we know for sure demand is weaker than those years.
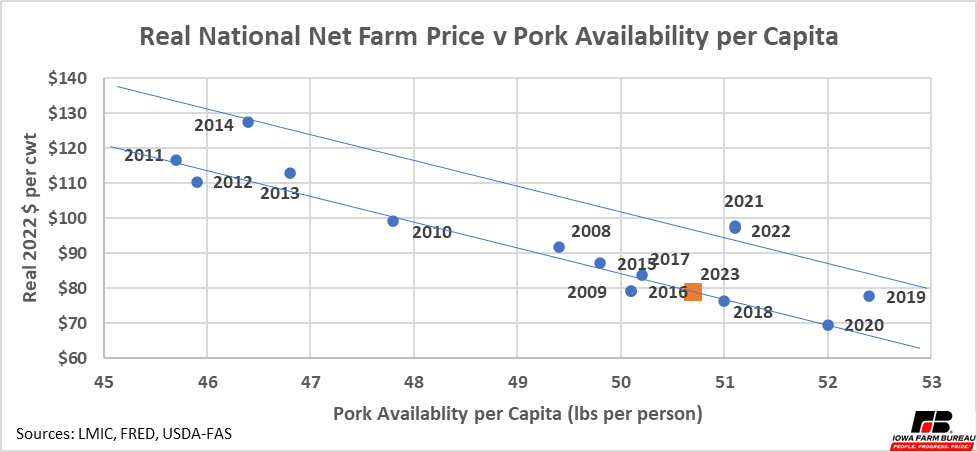
Figure 5. National Net Farm Price v Pork Availability per Capita
Export Demand
Demand can be broken into domestic demand and export demand. The USDA-FAS GATS database provides export data quantity and sales value which can be used to determine average price. Figure 6 uses this data to create a scatter plot similar to Figure 5, but only with export data. Only the 1st quarter of each year is plotted so all data is comparable. Prices are also adjusted for inflation as in the previous scatter plot.
So far this year pork exports demand looks to be relatively steady with last year. Quantity is up slightly but real prices are down. But export pork demand is down compared to 2020-2021. China was the major driver of higher exports from 2019-2021 when they needed more pork to compensate for the production lost to African swine fever (Figure 7). After China’s herd recovered, they no longer needed as much US pork. This drop in pork exports was felt between 2021 and 2022 but is not a driving factor in 2023 for now.
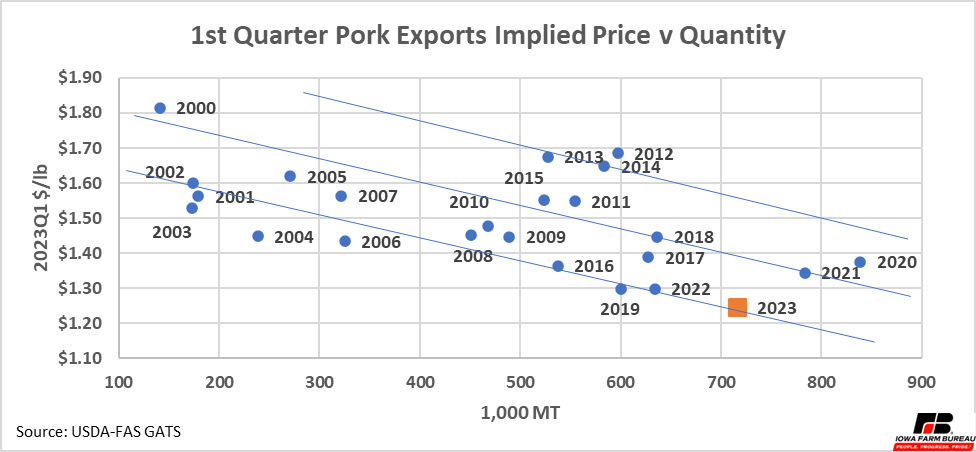
Figure 6. 1st Quarter Pork Exports Implied Price v Quantity
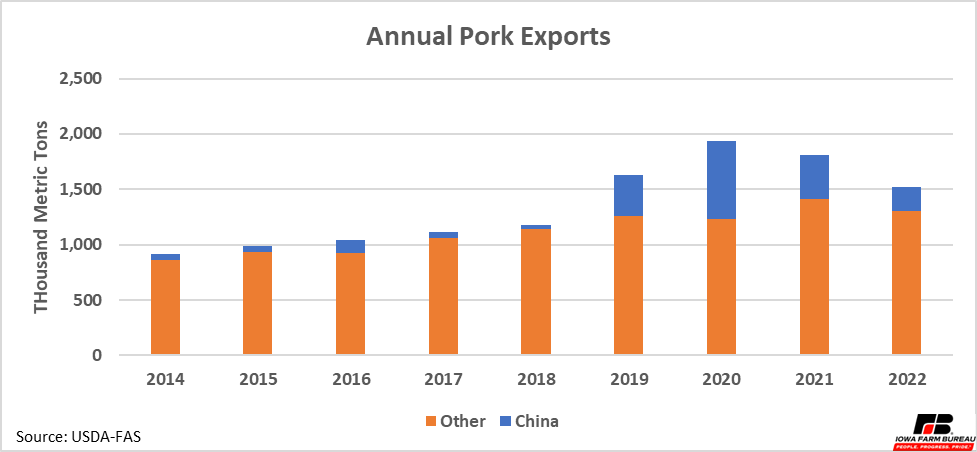
Figure 7. Annual Pork Exports
Because the quantities being exported are not softening, domestic demand is likely the source of weaker demand. Inflation continues to impact the economy, decreasing purchasing power. Real disposable income is down from the high in 2021, that was created by government stimulus payments (Figure 8). Consumer sentiment is also significantly lower than it has been in the past (Figure 9). As mentioned above, the price of bacon has come year-over-year. This may be a sign consumers are tightening their spending as both their real income and future economic outlook decrease.
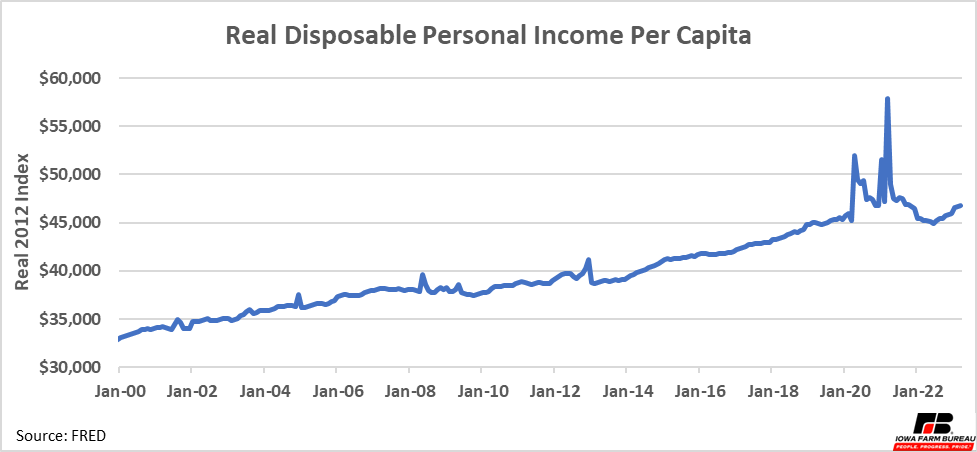
Figure 8. Real Disposable Personal Income Per Capita
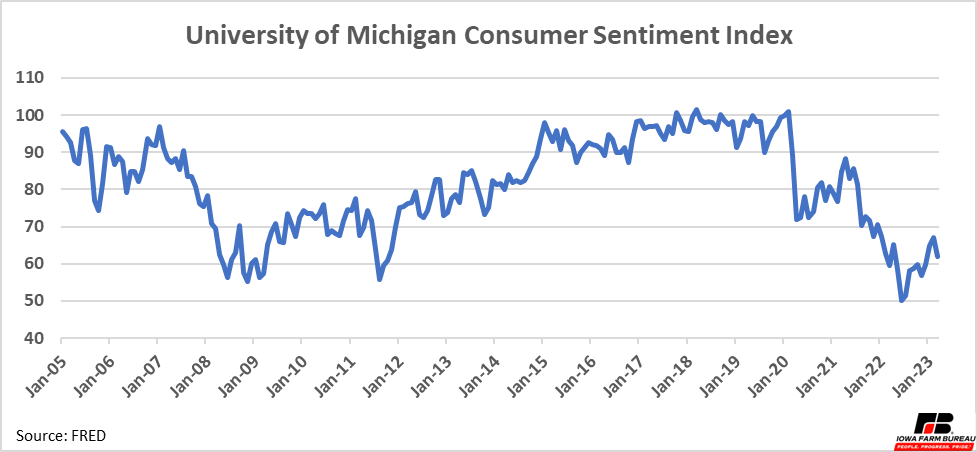
Figure 9. University of Michigan Consumer Sentiment Index
Want more news on this topic? Farm Bureau members may subscribe for a free email news service, featuring the farm and rural topics that interest them most!