Grain Shipment Disruptions from Mississippi Flooding
Author
Published
5/26/2023
River
In its weekly grain transportation report on May 18, 2023, the USDA noted that the Upper Mississippi River had reopened to barge traffic. The last lock & dam (L&D) to reopen was L&D 16 on May 13. Barge traffic had been stopped north of L&D 17 since April 23 due to flooding. L&D 17 is south of Davenport on the Iowa-Illinois border (Figure 1). Barge traffic further south was not interrupted.
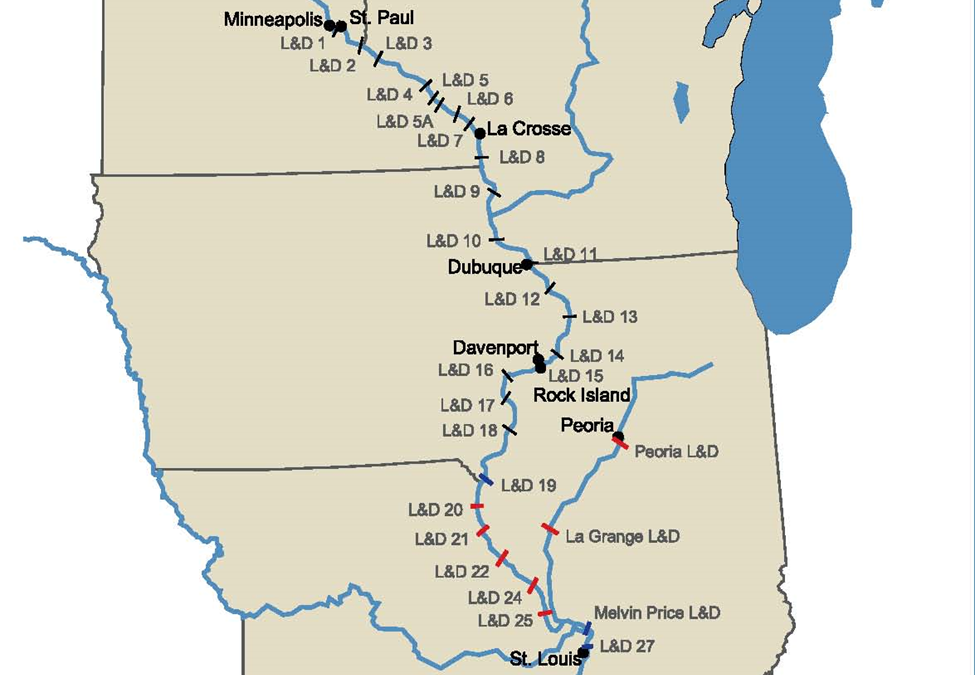
Figure 1. MS River Locks & Dams
Now that the flooding has subsided and the L&Ds have been reopened, the disruptions to grain traffic can be estimated. The USDA-AMS reports downbound grain shipments on the Mississippi river weekly at various L&Ds along the Mississippi. L&Ds in the upper Mississippi with reported data include L&D 15, L&D 25, L&D 26, and L&D 27. Because L&D 15 is the only one in the affected area, its data is used to estimate the effect the flooding and L&D closures had on grain movements.
Seasonal fluctuations in grain movements are common and are present at L&D 15 (Figure 2). Corn typically picks up in early May and is higher over the summer months. A peak shortly after harvest season is also noticeable. Soybeans see their largest movement during harvest season, prior to the corn harvest season peak.
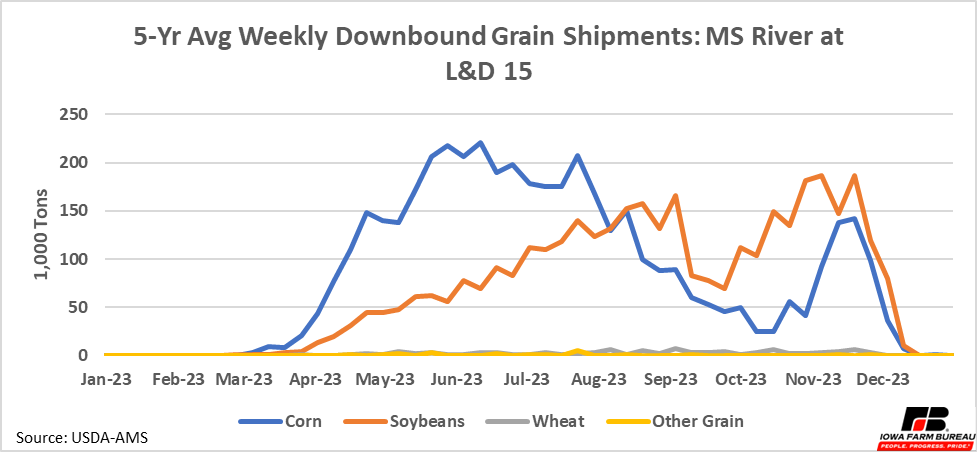
Figure 2. 5-Yr Avg Weekly Downbound Grain Shipments: MS River at L&D 15
Figure 3 shows 2023 year-to-date weekly total grain shipments versus the historical 5-year average and an adjusted 5-year average. The adjusted 5-year average is included because of differences in total exports year-to-year. This year the US is expected to have relatively lower corn and slightly higher soybean exports in terms of total bushels (Figure 4).
For simplicity, lower total exports are assumed to lead to proportionately lower barge shipments at every L&D. Therefore, because total corn exports are expected to be 23% lower this year than the 5-year average, the 5-year average for corn shipments is adjusted down by 23%. A similar calculation is done for soybeans. Because wheat and other grains make up a small share of total tons of grain for L&D 15, their 5-year averages are not adjusted.
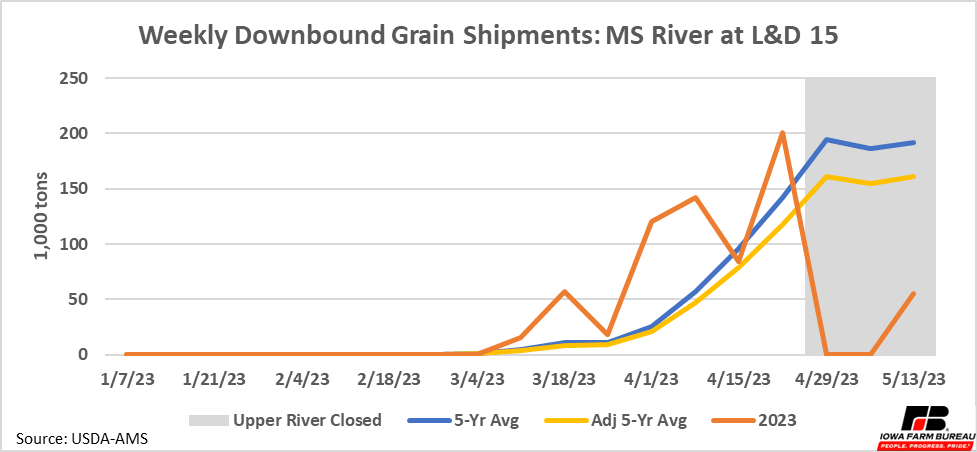
Figure 3. Weekly Downbound Grain Shipments: MS River at L&D 15
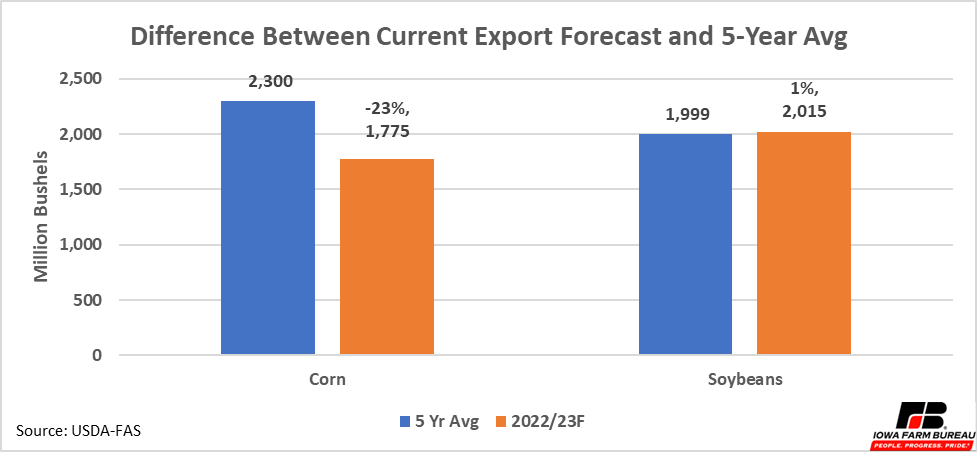
Figure 4. Difference Between Current Export Forecast and 5-Year Avg
Prior to the closure, grain shipments through L&D 15 were above the adjusted 5-year average. When the L&Ds were closed, L&D 15 throughput fell to zero for two weeks and was also low for a third week ending on May 13 (Figure 3). Using the adjusted 5-year average as a benchmark, an estimated 150,000 tons of grain was prevented from moving through L&D 15 the first two weeks of the closure and another 100,000 tons of grain were prevented from moving the third week of the closure (Figure 5).
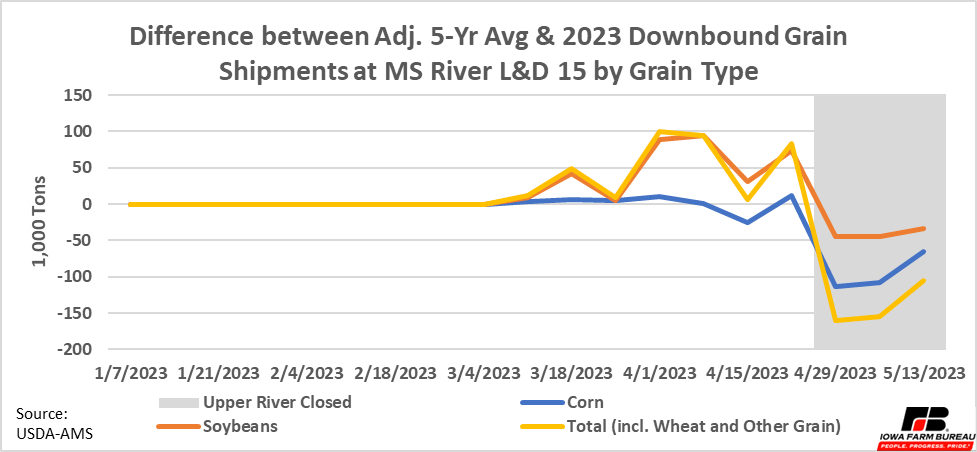
Figure 5. Difference between 2023 and 2003-2022 Avg Downbound Grain Shipments at MS river L&D 15 by Grain Type
With the flooding having subsided and upper Mississippi L&Ds open, barge traffic will begin to move again. Prior to the closure, corn movements through L&D 15 were close to the adjusted 5-year average while soybeans were ahead. On the other hand, total corn exports have been slow all year and this was reflected in lower barge shipments of corn. Corn exports will have some catching up to do in the last part of this marketing year to hit the USDA export target of 1,775 million bushels. It is possible corn’s export estimate will be adjusted lower by the end of the marketing year.
Want more news on this topic? Farm Bureau members may subscribe for a free email news service, featuring the farm and rural topics that interest them most!