Fall Rainfall Records
Published
10/19/2018
We are now a little over halfway through October and Iowa corn harvest progress is only at 17% and soybean harvest progress is 19% complete, which are both behind the 5-year averages of 24% and 51%, respectively. Many are wondering, how does this fall rainfall compare to other years?
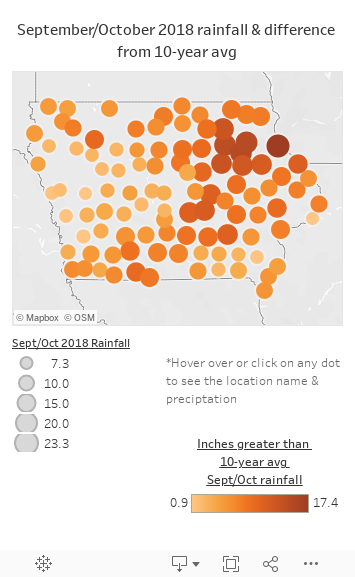
The following interactive map shows the total September/October precipitation by the size of the dot, and the color scale indicates how many inches the September/October precipitation is greater than the 10-year September/October average for that location. Note that the October 2018 data only includes half of the month at this point. You can hover over each of the dots on your computer to see the location name and precipitation values associated with it (if on your phone, click on the bubble instead).
Many locations in NE Iowa have seen September/October rainfall amounts exceeding 20 inches, which is much greater than normal. Guttenburg has received 23 inches of rainfall in September/October 2018, which is over 17 inches more than their 10-year average for September/October. Des Moines has received over 11 inches of rainfall in September and the first half of October 2018, which is over 5 inches greater than their 10-year average September/October precipitation. About 15% of the locations in this map have received greater than 10 inches more than their 10-year average precipitation for September and October.
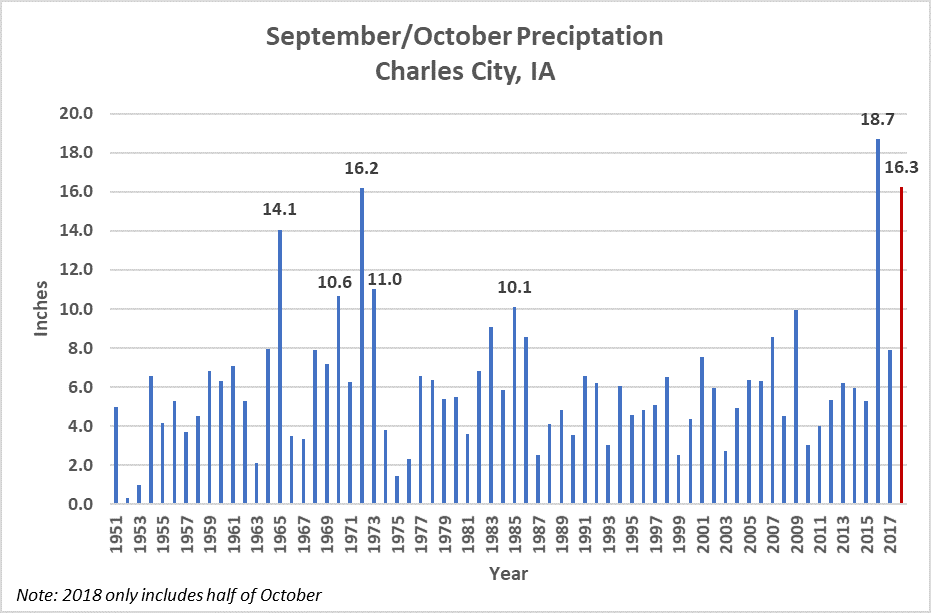
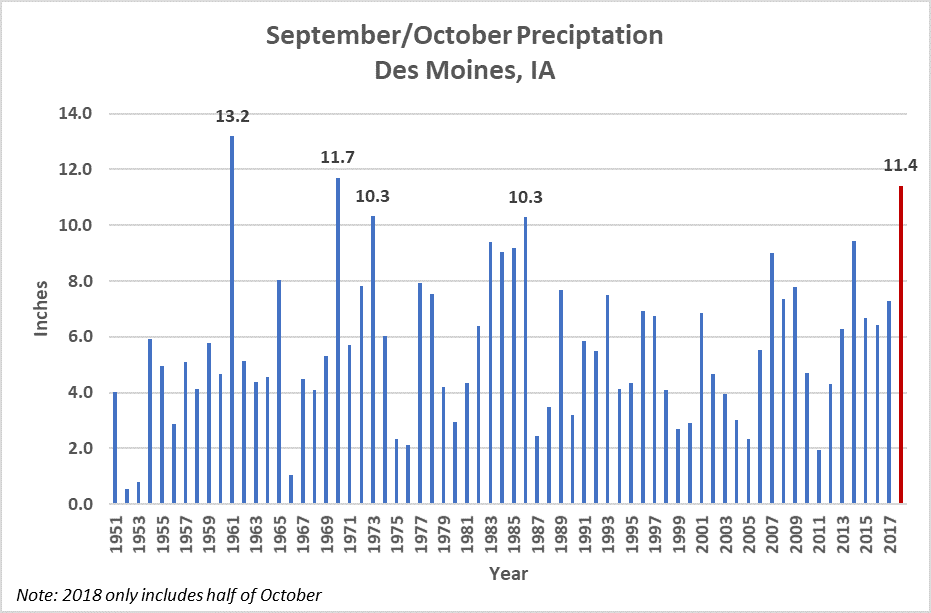
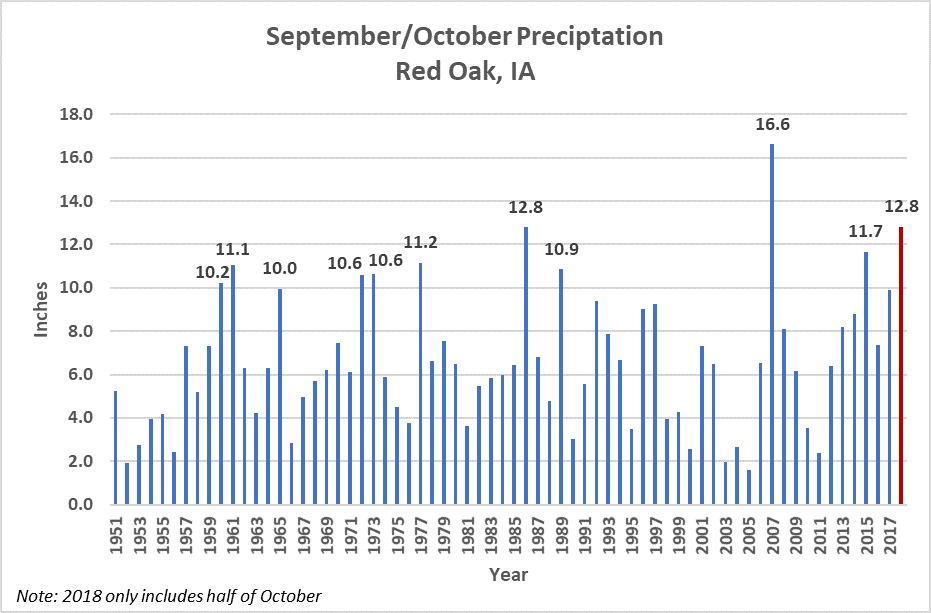
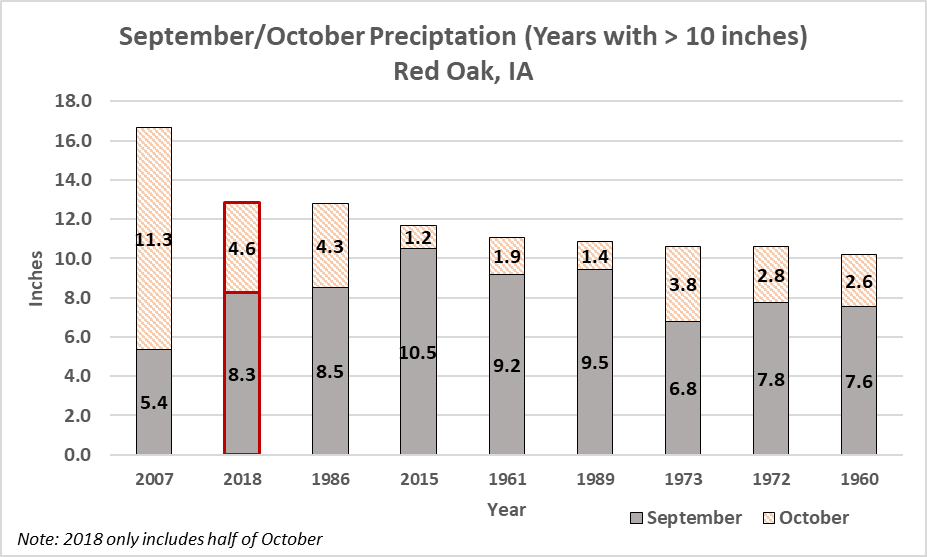
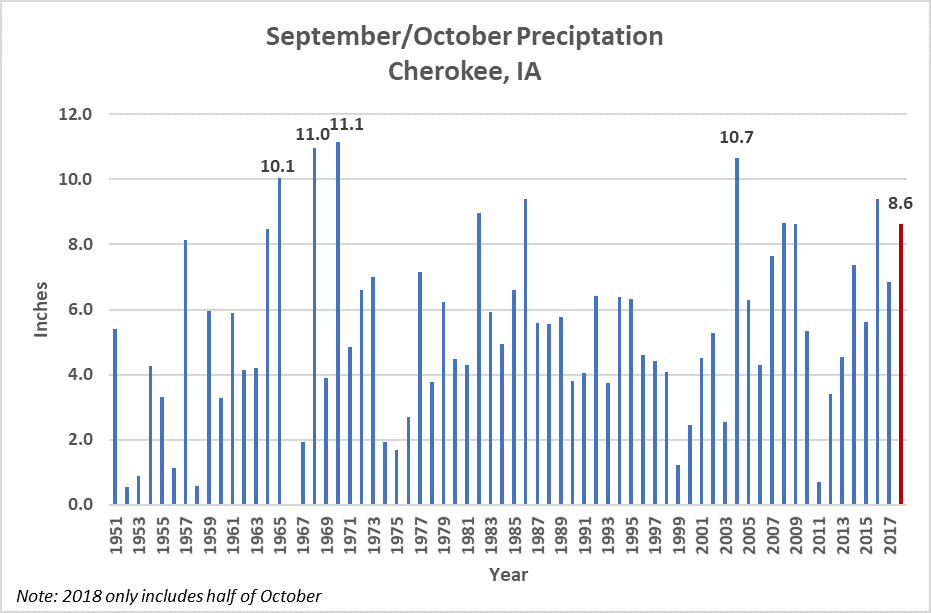
The graphs below for various locations across the state are based on data from the ISU Mesonet dataset and show September and October precipitation from 1951 to 2018. Note that the 2018 data (the red bar) only includes half of October at this point.
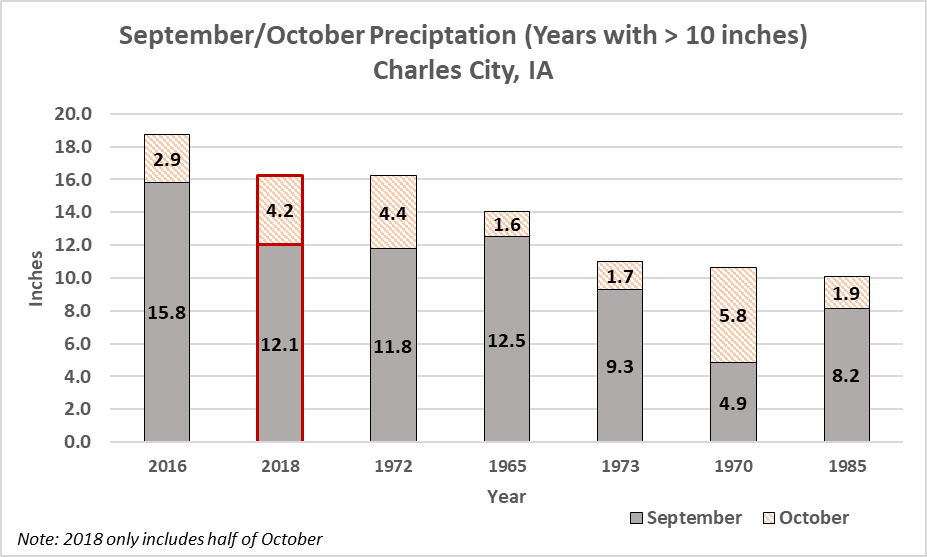
Charles City has had 7 years with 10+ inches of rainfall in September/October. The highest year was in 2016 with 18.7 inches, and 2018 isn’t far behind with 16.3 so far in September and half of October. This is the 10 th wettest October at the Charles City location, with half of the month remaining.
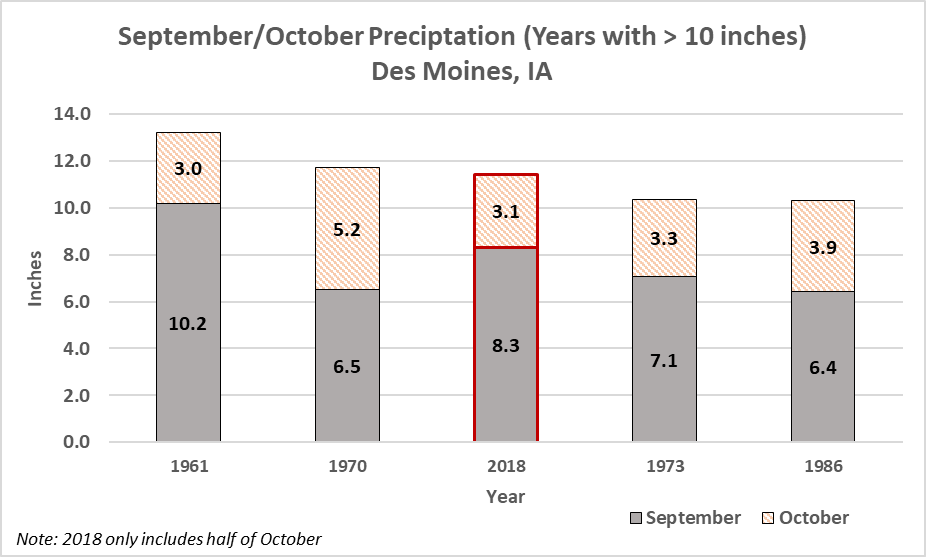
Des Moines has had 5 years since 1951 with 10+ inches of rainfall in September/October. The highest year was in 1961 with 13.2 inches. 2018 is the third highest with 11.4 inches so far in September in half of October. Des Moines recorded 8.3 inches of rain in September 2018, which is the second wettest September during this time period.
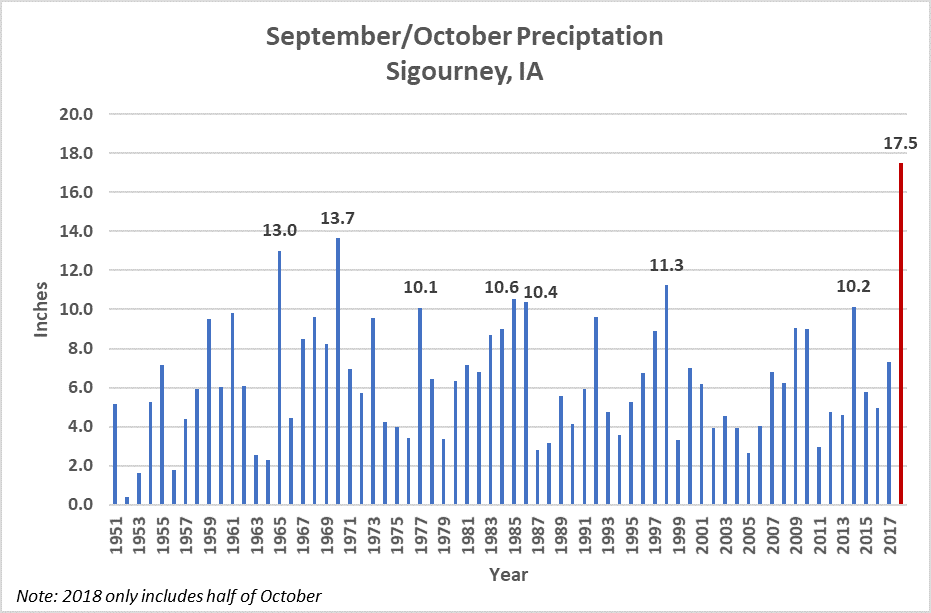
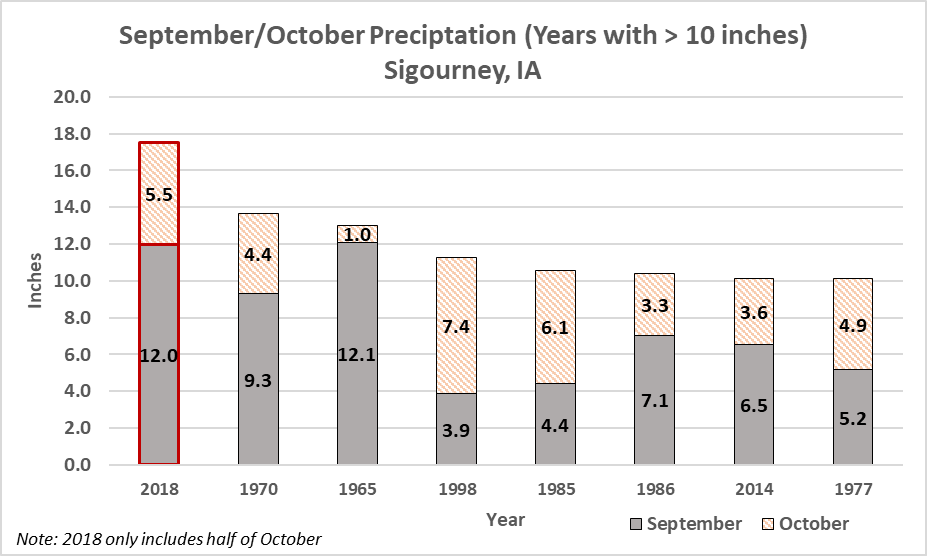
With the 2 nd highest September rainfall since 1951 and the 5 th highest October rainfall with only half of the month recorded, Sigourney has a record 17.5 inches of rainfall for September/October this year. The next highest was in 1970 with 13.7 inches.
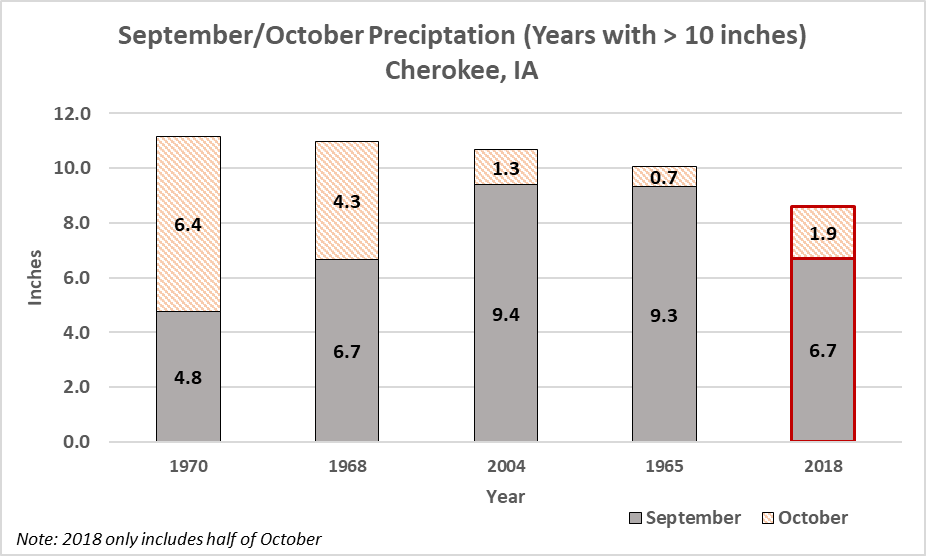
Cherokee was the only one of these selected locations that has not yet exceeded 10 inches of rain in September/ October 2018, with 8.6 inches currently. This is still the 6 th highest combined rainfall for September/October, with half of the month of October remaining. 2018 was the 4 th highest September rainfall since 1951 in Cherokee.
Michelle Mensing, Research Analyst, Decision Innovation Solutions (DIS). DIS is an Iowa-based economic research firm which provides regular farm economic research for Iowa Farm Bureau staff & members.
Want more news on this topic? Farm Bureau members may subscribe for a free email news service, featuring the farm and rural topics that interest them most!