Fall 2018: Crop Supply, Demand, and Storage Capacity
Author
Published
12/18/2018
2018 Fall Supply
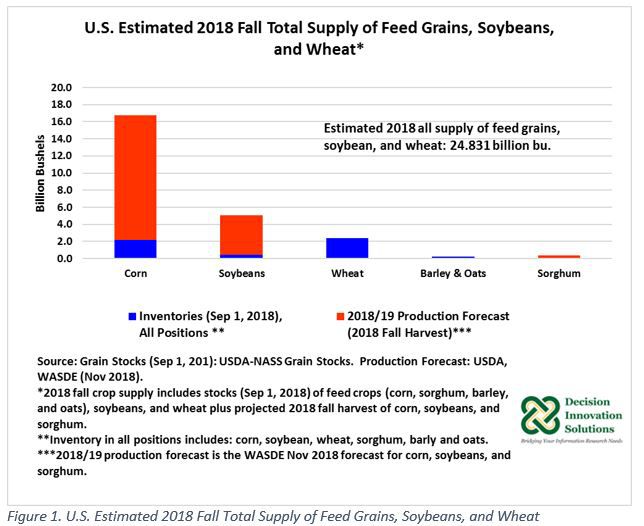
The last Crop Progress report released by USDA on November 26, 2018, indicated the top 18 corn and soybeans producing states were 90 percent and 91 percent harvested, respectively. The World Agricultural Supply and Demand Estimates (WASDE) report released by USDA on December 10, 2018, projected 2018/19 corn production at 14.626 billion bushels, which if realized, would be the second largest after 2016 (15.148 billion bushels). In addition, USDA projected soybean production this marketing year may reach a record high volume of 4.600 billion bushels. The USDA also projected 2018/19 sorghum production at 0.364 billion bushels. When combining high stocks of corn and soybeans on September 1, 2018, as reported in the USDA Grain Stocks publication, namely, 2.140 billion bushels of corn and 0.438 billion bushels of soybeans, this fall supply could have reached a record high of 16.766 billion bushels of corn and 5.038 billion bushels of soybeans. At the same time, the USDA also reported an inventory of 2.379 billion bushels of wheat and 0.284 billion bushels of other feed grains (sorghum, barley, and oats). The overall 2018 fall supply of feed grains (corn, sorghum, barley, and oats), soybeans, and wheat is estimated at 24.831 billion bushels (see Figure 1). The estimated 2018 fall supply is up 326 million bushels compared with the same time a year earlier.
Grain Storage Capacity
The latest information on U.S. grain storage capacity published by the USDA-NASS in the Grain Stocks report (January 2018) indicates grain storage capacity in the United States totaled 24.690 billion bushels on December 1, 2017, up 1 percent from December 1, 2016. U.S. grain storage capacity is spread among several states. The state with the largest storage capacity was Iowa with 3.570 billion bushels. Grain storage capacity in Iowa by the end of 2017, was up 3 percent (90 million bushels) year-over-year. Iowa added 50.0 million in on-farm capacity and 40 million in off-farm capacity. Other states with storage capacity above 2 billion bushels were Illinois (2.97 billion bushels), Minnesota (2.31 billion bushels), and Nebraska (2.11 billion bushels). Storage capacity for Illinois and Minnesota continued the same as in 2016, whereas storage capacity in Nebraska increased by 7 million bushels in terms of on-farm capacity. In addition, total storage capacity increased by 25 million bushels in Kansas to 1.48 billion bushels, while total storage grew by 20 million bushels in Missouri and Ohio each, to total storage capacity equal to 0.82 billion bushels and 1 billion bushels, respectively.
September-November 2018 Usage: Feed Grains, Soybean, and Wheat
Except for exports, demand estimates during the 2018 fall quarter (Sep-Nov) for feed grains, soybeans, and wheat, were based on the average share of the previous three years fall use relative to total annual use, which was applied to the projected 2018/19 annual usage of each one of these crops, as reported in the Dec 2018 WASDE report. This procedure was used since USDA has not yet reported quarterly data corresponding to the first quarter of the 2018/19 marketing year and it follows and adapts a procedure used by Good (Good D., Farmdoc Daily (4): 202). Feed grains, soybeans, and wheat export sales estimates were based on the USDA-FAS weekly export sale report as of Nov 29, 2018.
Feed grains usage for food, seed, and industrial (FSI) is mostly for corn, particularly, for corn ethanol production. The most recent historical three-year average FSI usage during September to November period represented 24.6 percent of total annual corn FSI usage. WASDE projection for corn FSI annual usage in 2018/19 is 7.080 million bushels. Corn’s FSI usage during the 2018 fall (September-November) period was estimated at 1.741 billion bushels (see Figure 2). FSI for sorghum, barley, and oats, was estimated at 78 million bushels.
USDA-FAS data indicates U.S. corn export sales from the beginning of the current marketing year to November 29, 2018, reached a volume of 581 million bushels, up 83 percent compared with the same period last marketing year. Adding 12 million bushels in U.S. export sales of sorghum, barley, and oats, during the September to November months, total U.S. export sales of feed grains during the 2018 fall was estimated at 594 million bushels.
Based on December’s WASDE report, USDA’s projection for 2018/19 corn usage for feed and residual was 5.500 billion bushels. The estimated share of corn usage for feed and residual was 42.21 percent, on average, during the months of September to November of the previous three years (2015/16-2017/18). Corn use for feed and residual was estimated at 2.322 billion bushels (see Figure 2). Sorghum, barley, and oats usage during the September to November was estimated at 48 million bushels. Feed grains FSI total usage during the fall was estimated at 2.369 billion bushels.
Based on these estimates, total feed grain usage for FSI, exports, and feed and residual during September to November 2018, was likely about 4.782 billion bushels.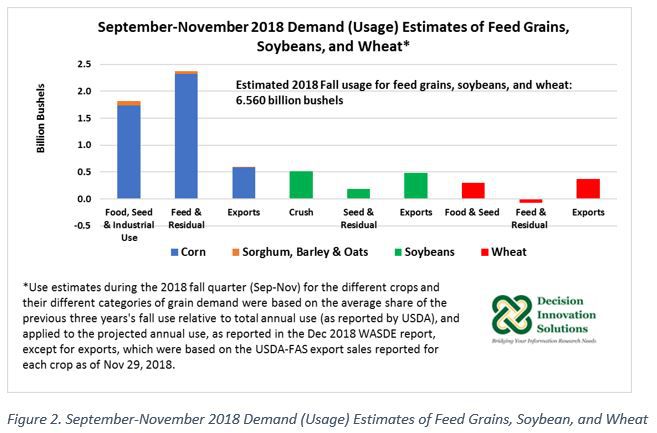
USDA projects 2.080 million bushels of soybeans for crush during the 2018/19 marketing year. Based on this projection and the most recent soybean usage for this purpose during the fall, the domestic soybean crush during September to November 2018 was estimated at 517 million bushels (see Figure 2).
As indicated by USDA-FAS data, soybean export sales from the beginning of the 2018/19 marketing year to November 29, 2018 were equal to 484 million bushels, down 43 percent from the volume exported during the same period last year. Due to retaliatory trade tariffs imposed by the main U.S. soybean customer abroad, China, U.S. exports of soybeans declined substantially during the 2018 fall. As an account used to balance the soybean sheet, the quarterly use for seed and residual varies from amounts higher than the final annual usage to negative usage. Soybean usage for seed and residual was estimated at 184 million bushels from September through November 2018.
The total soybean usage, including usage for crush, exports, and seed and residual, in the first quarter of the 2018/19 marketing year, was near 1.185 billion bushels.
Finally, following the seasonal consumption of wheat for food and seed usage during the fall, the September- November wheat usage for this purpose was about 297 million bushels. The usage pattern for feed and residual during the fall is negative in the recent historical period. The estimate for the fall of 2018 was around -74 billion bushels, while wheat export sales from September to November 29, 2018, were equal to 370 million bushels. In total 593 million bushels of wheat were most likely used during September to November 2018.
Overall, based on these estimates, usage of feed grain, soybeans, and wheat during September to November 2018 was near 6.560 billion bushels. These estimates indicate about 26 percent of the 2018 fall supply has been already consumed.
At first look, storage capacity (24.690 billion bushels) would seem insufficient for the total 2018 fall grain supply (24.831 billion bushels) by about 140.923 million bushels; however, fall grain supplies continuously change because of the usage of feed grains, soybeans, and wheat during the fall period (September to November). With demand of feed grains, soybeans, and wheat most likely around 6.560 during the fall of 2018, the perceived limitation in storage capacity might have been non-existent. In addition, according to USDA data, for the first time in seven years, corn exports during the fall surpassed soybean exports resulting from the decline in exports to China. As indicated by USDA in November 2018, the switch in exports changed the routing of some grain and oilseed movements, which opened additional storage and transportation capacity during this year’s harvest, which might have helped improve U.S. corn export competitiveness during the fall of 2018. Moreover, storage capacity might have increased during 2018. USDA will publish both U.S. grain stocks as of December 1, 2018, and grain storage capacity at that time, in the January 2019 publication Grain Stocks. Also, in January 2019, USDA will publish final harvest estimates for corn, soybeans, and sorghum for the 2018/19 marketing year.
Want more news on this topic? Farm Bureau members may subscribe for a free email news service, featuring the farm and rural topics that interest them most!