Ethanol Industry in Iowa and the U.S.
Author
Published
1/24/2023
Ethanol Production
Ethanol is an important part of the Iowa and US economy. Iowa ethanol production was recently estimated to be a record 4.5 billion gallons in 2022 by the Iowa Renewable Fuels Association. Iowa and US ethanol production since the 1980s are shown in Figure 1. Ethanol production grew most rapidly in the mid-2000s but has still shown moderate growth since 2010. The large drop in 2020 was due to the COVID-19 pandemic which reduced demand for travel, which caused gasoline and ethanol demand to fall as well.
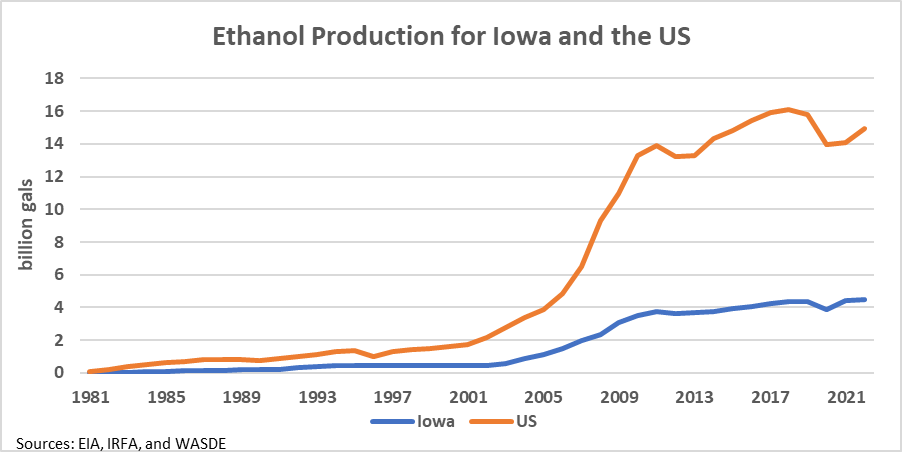
Figure 1. Ethanol Production for Iowa and the US
As ethanol production has grown it has become an important source of demand for corn in the US and especially in Iowa. Every bushel of corn yields roughly 2.8 gallons of ethanol. Ethanol yields were lower in the 1980s (around 2.5 gallon per bushel) and increased to 2.8 gallons per bushel over time. Ignoring this fact and assuming yields were constant at 2.8 gallons per bushel over time the amount of corn used for ethanol production was estimated for Iowa and US. Figure 2 compares estimated corn used for ethanol to the previous year’s corn production for Iowa and the US. The previous year’s corn production number is used for comparison as most corn growth in a certain year is used in the following year. It is not a perfect comparison, but it does provide insight into how much corn is used for ethanol production, and therefore how important ethanol is to Iowa and US agriculture. Historically a larger share of Iowa’s corn has been used for ethanol relative to the US. In recent years 50-70% of Iowa corn production is used to make ethanol and 35-40% of US corn is used for ethanol.
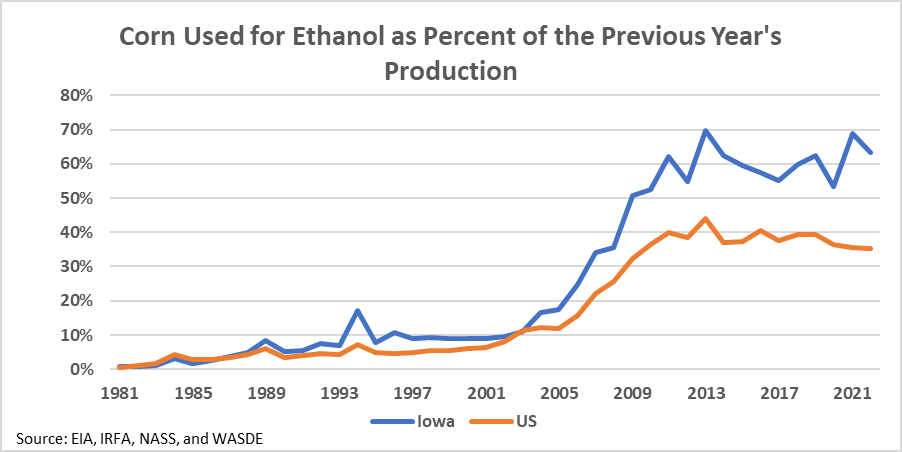
Figure 2. Corn Used for Ethanol as a Percent of the Previous Year’s Production
Ethanol Operating Margins
Like any industry, ethanol production must be financially profitable to continue operating. Costs between ethanol plants are likely to vary due to factors like facility infrastructure, management, and debt level. However, the general health of the industry can be captured by looking at the margin between the total value of commodities produced at an ethanol plant and the value of the corn used to produce them.
Besides ethanol, ethanol plants also produce DDGS and corn oil as by-products. The prices for each product and the average price of corn are shown in Figure 3 on a per pound basis.
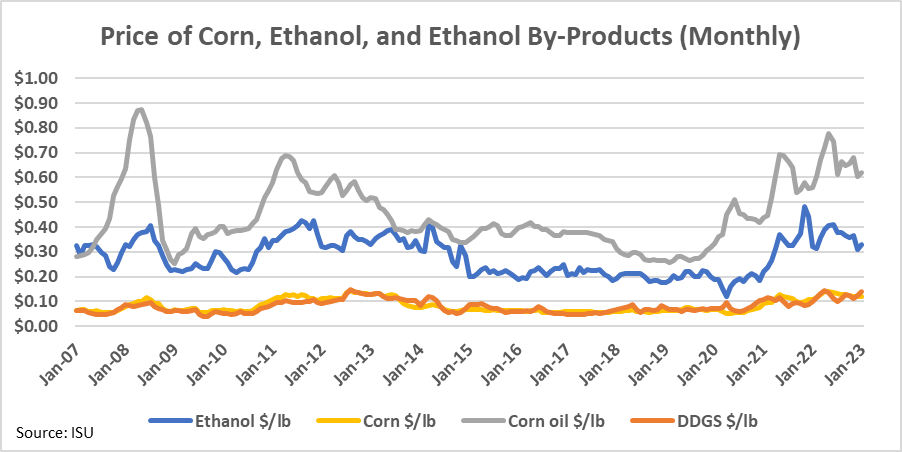
Figure 3. Price of Corn, Ethanol, and Ethanol By-Products (Monthly)
Assuming each bushel of corn yields 2.8 gallons of ethanol (18.48 pounds), 17 pounds of DDGS, and 0.7 pounds of corn oil the average ethanol margin is calculated (Figure 4). In 2007 and 2008, margins were high which encourage expansion of the ethanol industry. Following a long spike from 2013-2015, margins became more modest. Another spike occurred in 2021, but margins have again moved down to more modest levels, sitting around $2.00 per bushel.
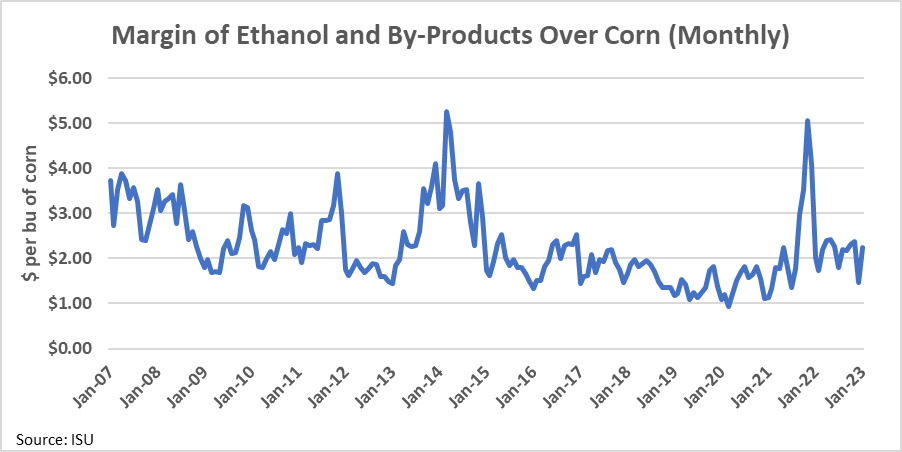
Figure 4. Margin of Ethanol and By-Products Over Corn (Monthly)
Note the margin in Figure 4 does not account for other processing costs. As noted above these can vary from plant to plant for a variety of factors. Some assumptions on these factors can provide further insight into how the ethanol market is performing. Assuming it takes 0.026 per MMBtus of natural gas to produce 1 gallon of ethanol and other operating costs total $0.30 per gallon of ethanol produced the operating margin of ethanol production is calculated is shown in Figure 5. These operating assumptions are the same assumptions used in Iowa State’s Ethanol Margin Calculator.
Keep in mind operating costs likely vary by ethanol plant, so the operating margin of a specific ethanol plant likely is different than is estimated in Figure 5. More efficient plants will have higher operating margins while less efficient plants will have lower operating margins.
Furthermore, it is important to remember the operating margin does not account for capital costs. All plants will have some level of capital costs that need to be deducted from the operating margin as well. Higher operating margins allow more room for plants to cover capital costs and encourage expansion in an industry. Lower operating margins leave less or sometimes no room for plants to cover capital costs and indicate the industry is producing more ethanol than the market is demanding.
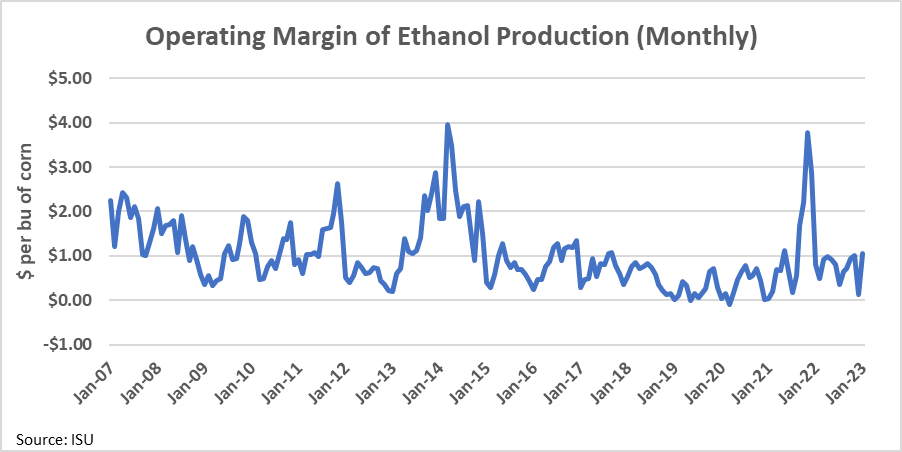
Figure 5. Operating Margin of Ethanol Production (Monthly)
Notice the operating margin even dips below zero briefly at times in 2019, 2020, and 2021. Since the most recent spike in late 2021, the margin has been between $0-$1 per bushel. Operating margins were estimated to be as low as $0.12 per bushel in December 2022, the most recent low.
While operating margin had spikes from 2013-2015 and in late 2021, the margin has generally decreased over time. This decrease is not surprising. As mentioned earlier higher margins encourage industry expansion while margins near zero discourage expansion and in some case induce industry contraction.
Ethanol demand was rapidly increasing in the late 2000’s and early 2010s which encouraged industry expansion. Spikes and swings in the margin like what occurred from 2013-2015 occur in most markets and mean short run demand was greater than short run supply. Ignoring these spikes, margins have been lower in the late 2010s and early 2020s as ethanol demand has grown more slowly and less expansion has been needed.
Conclusion
Ethanol is an important source of demand for Iowa’s corn crop. Operating margins are down from a recent spike at the end of 2021 and in general are lower than they were in the early 2010’s. Still margins continue to sit at or slightly above breakeven levels, which is typical for a competitive market.
Economic analysis provided by Aaron Gerdts, Research Analyst, Decision Innovation Solutions on behalf of Iowa Farm Bureau.
Want more news on this topic? Farm Bureau members may subscribe for a free email news service, featuring the farm and rural topics that interest them most!