Crop Insurance Performance in Iowa and the U.S.
Author
Published
7/22/2022
Crop Insurance Performance in Iowa and the U.S. (7/20/22)
One method to evaluate the Federal Crop Insurance Program is by examining loss ratios. The Federal Crop Insurance loss ratio is the ratio of indemnity payments to premium payments. Indemnity payments are the funds paid out by the USDA to farmers to cover claims and premiums are the funds paid by all farmers to participate in the program. The loss ratio is essentially the ratio of money paid out to money taken in by the USDA through the Federal Crop Insurance Program.
A ratio of 1.0, means the total payments out equal total premiums collected. A ratio greater than 1.0 means the USDA paid out more money than it collected through premiums and a ratio of less than 1.0 means the USDA paid out less money than it collected through premiums. When setting premiums, the USDA aims for a loss ratio slightly less than 1.0.
The loss ratios of the federal crop insurance program for the U.S. and Iowa from 1989-2021 are given in Figure 1. The gray shaded region covers loss ratios of 1.0 or less. Since 1989, the U.S. has had a loss ratio greater than 1.0 thirteen times (40% of the years). Iowa has a loss ratio greater than 1.0 six times (19% of the years). There have only been three years in which Iowa had a loss ratio greater than 1.0 and the U.S. did not. Those years were 2008, 2014, and 2020.
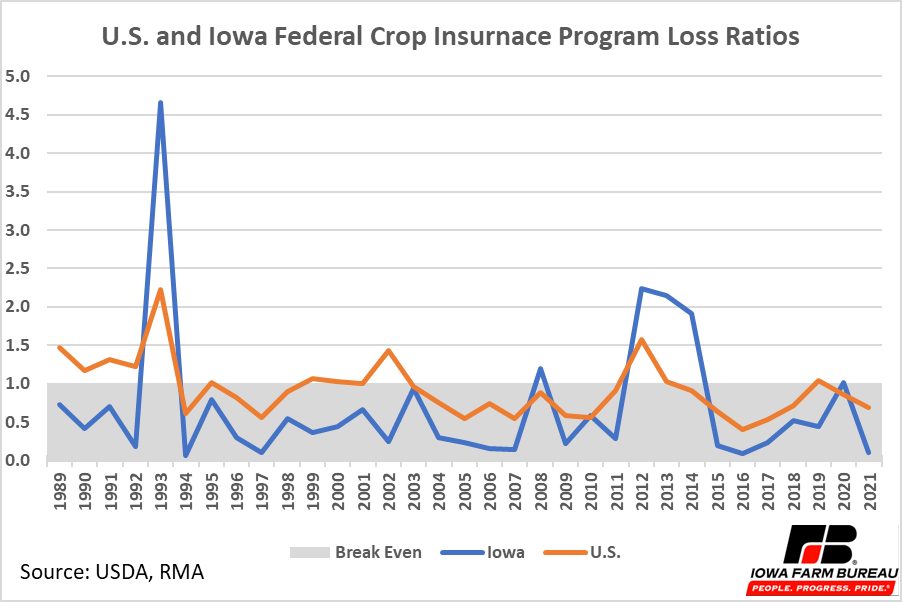
Figure 1. U.S. and Iowa Federal Crop Insurance Program Loss Ratios
Figure 2 shows 2021 Federal crop insurance loss ratios at the county level. In 2021, most Midwest counties had relatively low loss ratios. Counties in the northwest had higher loss ratios relative to most other U.S. counties.
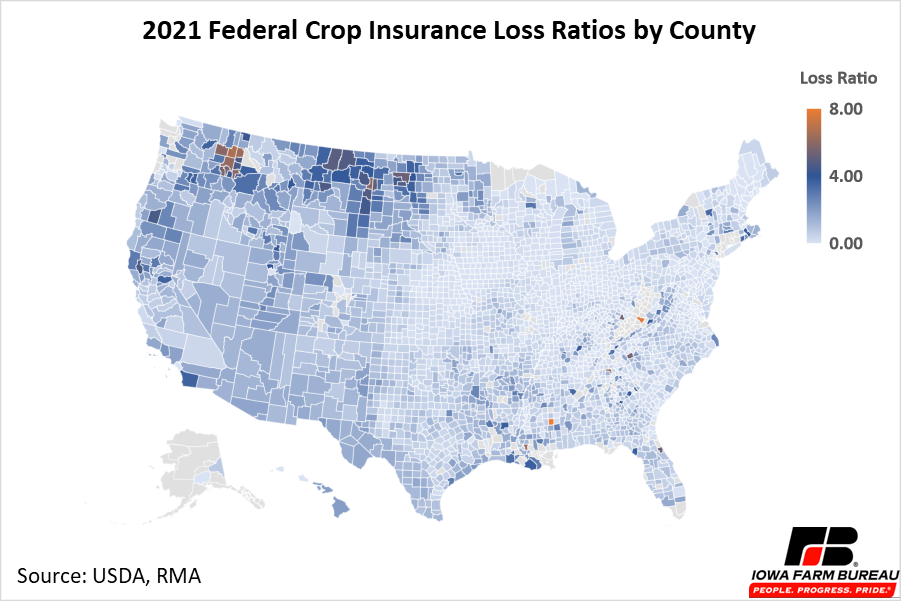
Figure 2. 2021 Federal Crop Insurance Loss Ratios by County
A closer look at Iowa shows every county in Iowa had a loss ratio below 1.0 in 2021 (Figure 3). The five counties with the highest loss ratios in Iowa were Des Moines, Van Buren, Henry, Plymouth, and Jefferson. The five counties with the lowest loss ratios were Harrison, Audubon, Jasper, Shelby, and Calhoun.
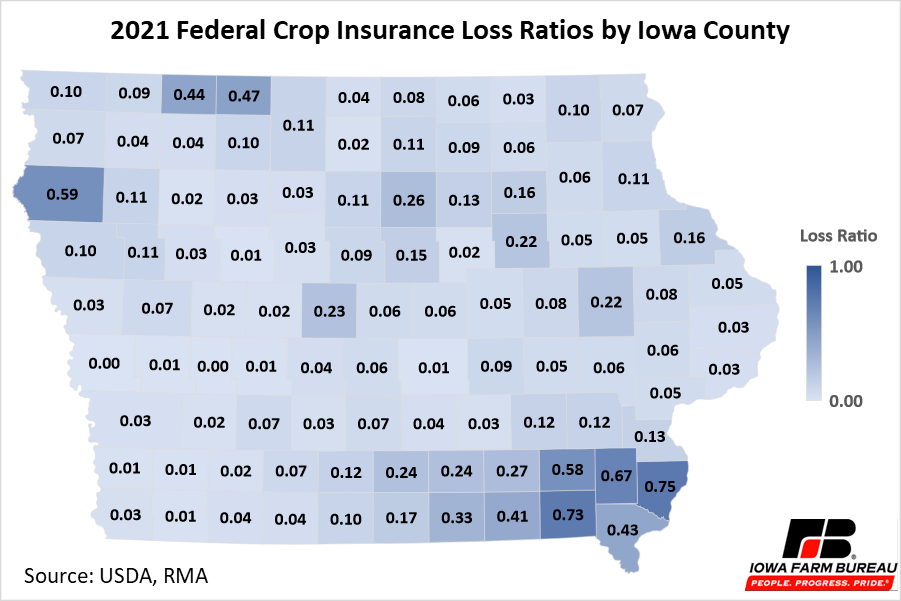
Figure 3. 2021 Iowa County Federal Crop Insurance Loss Ratios
Figure 4 shows the 20-year average loss ratios for each state. Average loss ratios over the past 20 years for each state have ranged from 0.55 to 1.34. The five states with the highest loss ratios over the past 20 years were Nevada, Utah, Massachusetts, Oregon, and New Mexico. The five states with the lowest loss ratios over the past 20 years were Maryland, New Jersey, Nebraska, Delaware, and Ohio.
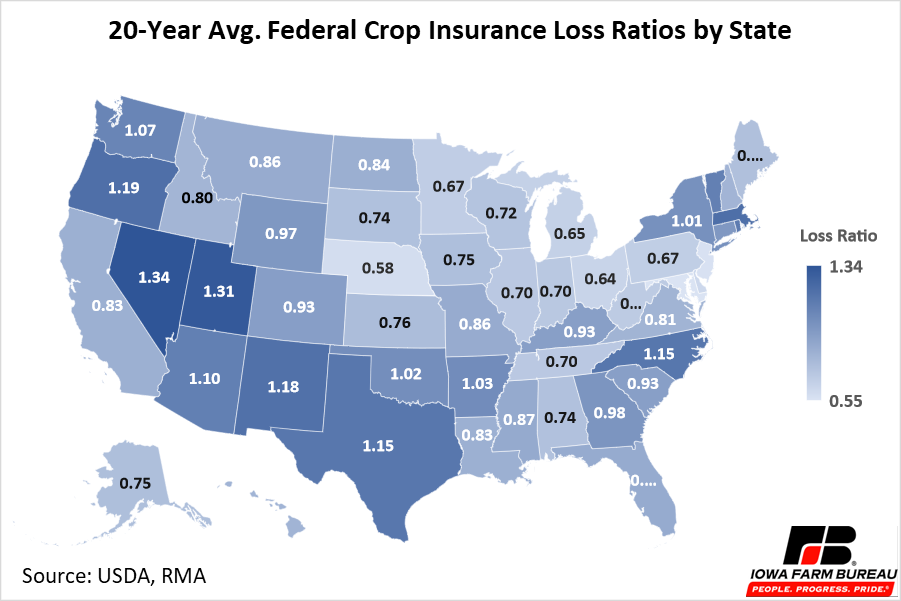
Figure 4. 20-Year Average Federal Crop Insurance Loss Ratios by County
The 20-year average loss ratio for each county in Iowa is given in Figure 5. Average loss ratio over the past 20 years for each county in Iowa has ranged from 0.43 to 1.35. The five counties with the highest loss ratios over the past 20 years were Davis, Appanoose, Wayne, Monroe, and Carroll. The five counties with the lowest loss ratios over the past 20 years were O’Brien, Cherokee, Osceola, Shelby, and Louisa.
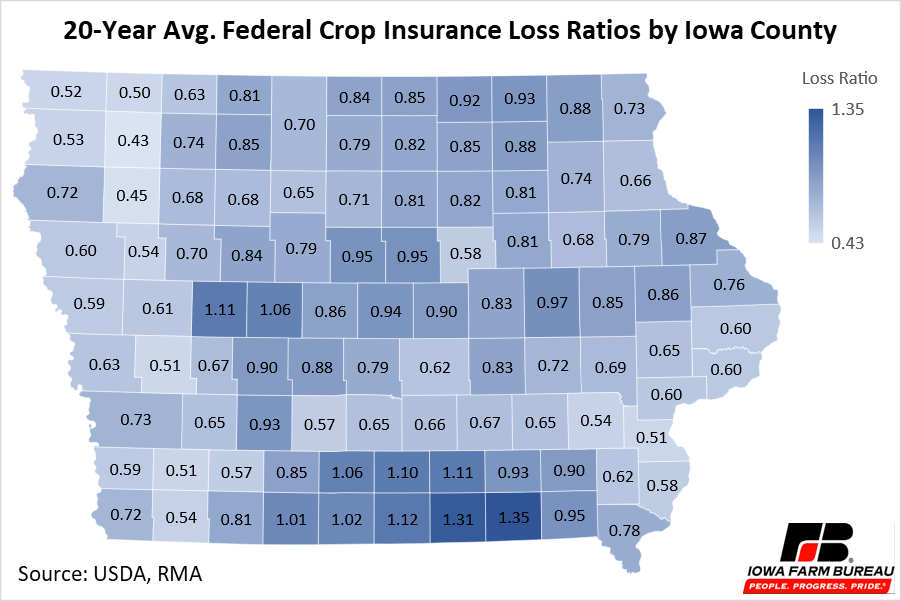
Figure 5. 20-Year Avg. Federal Crop Insurance Loss Ratios by Iowa County
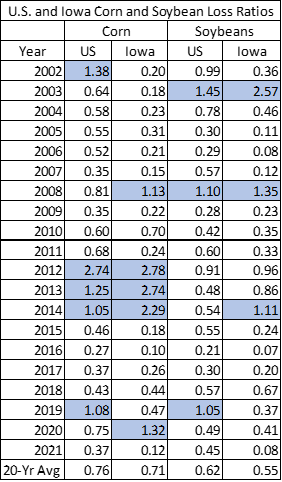
Around 90% of crop land in Iowa is planted to corn or soybeans, and as a result, Iowa loss ratios are driven by corn and soybean loss ratios. The loss ratios of corn and soybeans over the last 20 years for Iowa and the US given in Table 1. Loss ratios over 1.0 are highlighted in blue. Iowa has a lower average loss ratio over the past 20 years than the U.S. for both corn and soybeans. Iowa’s 20-year average loss ratio for corn is 0.71 whereas the U.S. loss ratio is 0.76. For soybeans, Iowa’s 20-year loss ratio is 0.55 and the U.S. loss ratio is 0.62. Both the U.S. and Iowa loss ratios are well below the 1.0 breakeven mark.
Table 1. US. and Iowa Corn and Soybean Loss Ratios
Economic analysis provided by Aaron Gerdts, Research Analyst, Decision Innovation Solutions on behalf of Iowa Farm Bureau.
Want more news on this topic? Farm Bureau members may subscribe for a free email news service, featuring the farm and rural topics that interest them most!