Cattle Report – July 2022
Author
Published
7/28/2022
Cattle Report – July 2022
Since 1973, US cattle inventories have been reported on January 1 and July 1 each year. The inventory of all cattle and calves in the U.S. on July 1, 2022, was 98.8 million head (Figure 1). This is down 2.0% from July 1, 2021. July inventories are typically higher than January inventories as spring calves have not been born when the January inventory is taken.
The inventory of beef cows in the U.S. on July 1, 2022, was 30.4 million (Figure 2). This is a 2.4% decrease from July 1, 2021. January and July inventories of beef cows are typically similar. Liquidation of the cow herd is occurring and is a likely response to very dry pasture conditions in the southern Plains states and many western states.
Historically, U.S. beef cow inventories have followed a 10-year cycle. The cycle consists of a period of U.S. herd expansion and a period of reduction. The gray bars in multiple figures represent periods of U.S. beef cow herd expansion. Any two subsequent periods of expansion and reduction together make up one cattle cycle. For example, the expansion period from 2005 to 2006 and the reduction period from 2007 to 2014 make one cattle cycle. The U.S. is currently in a period of herd reduction that started in 2019 and continues today.
The cattle cycle occurs because of the relatively long life-cycle of cattle compared to other livestock species. When prices begin to increase and the expected profitability of cattle becomes higher, more heifers are kept for replacements instead of being sent to the feedlot. This increase in heifer replacements eventually leads to increased cow and calf inventories. Increases in the supply of beef cattle sent to slaughter eventually leads to decreases in prices especially if overall demand has not increased. As prices decrease, producers begin culling more cows and keeping less replacement heifers. This causes cow inventories and beef prices to drop. As the supply of cattle and calves decreases, prices eventually begin to rise, and the cycle starts over again.
The relationship between the cattle cycle and replacement inventories is shown in Figure 3. The peak of replacement heifers occurs slightly before the peak of beef cow inventory. In contrast to total cow and calf inventories, January replacement heifer inventories are typically higher than July inventories because bred heifers due in the spring with their first calf are still considered replacements.
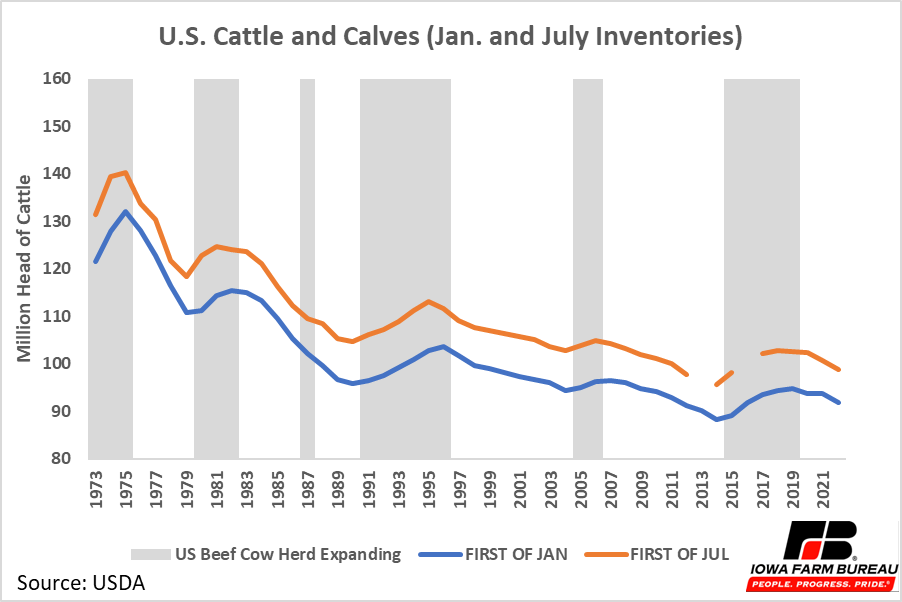
Figure 1. U.S. Cattle and Calves (Jan. and July Inventories)
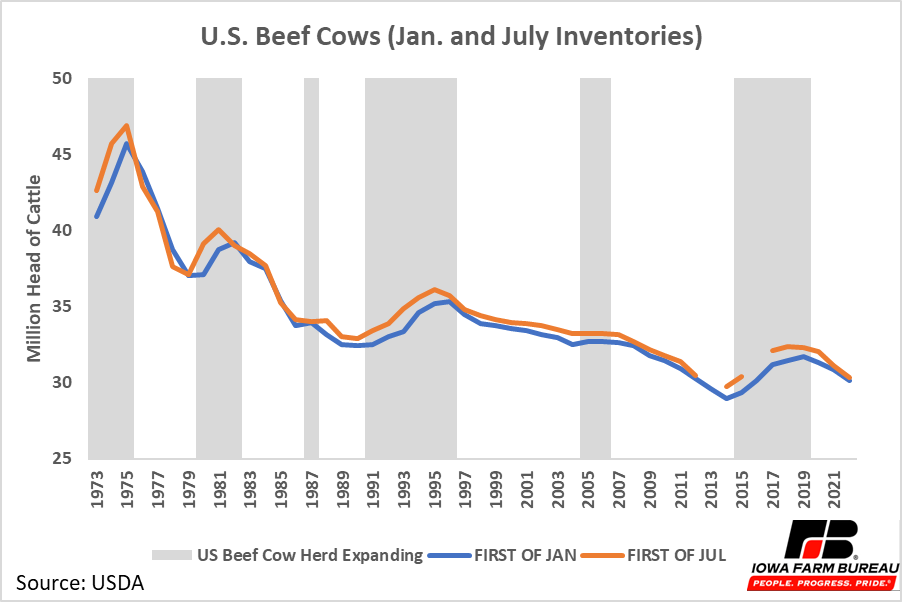
Figure 2. U.S. Beef Cows (Jan. and July Inventories)
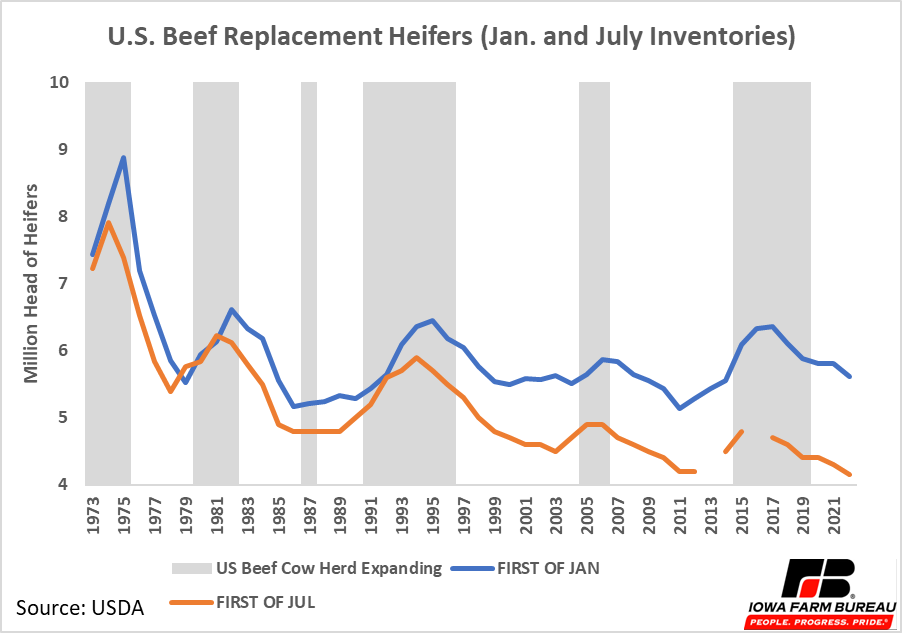
Figure 3. U.S. Beef Replacement Heifers (Jan. and July Inventories)
While national cattle and calf inventories are reported in January and July, Iowa cattle and calf inventories are typically only reported in January. The inventory of all cattle and calves in Iowa on January 1, 2022, was 3.85 million (Figure 4). This represented 4.2% of all U.S. cattle and calves. This was a 4.1% increase compared to Iowa’s January 2021 inventory. The inventory of beef cattle in Iowa on January 1, 2022, was 930,000. This represents 3.1% of the total U.S. beef cow herd. This was an increase of 7.6% compared to Iowa’s January 1, 2022.
For comparison to the national cattle cycle, gray bars marking expansions of the U.S. beef cow herd are included in Figure 4 as well. Prior to 1990, Iowa cattle inventories generally followed the national cattle inventory cycle. However, from 1990 to 1996 the U.S. beef cow herd experienced an expansion phase, growing by 8.5% in that time period. In contrast, the Iowa beef cow herd shrunk by 5.4% during the same time period. Both U.S. and Iowa cattle numbers declined from 1996 to 2003. In 2004, Iowa cattle number began following the national cycle again, until 2022. In January 2022, Iowa beef cow inventories increased while U.S. beef cow numbers continued to decline.
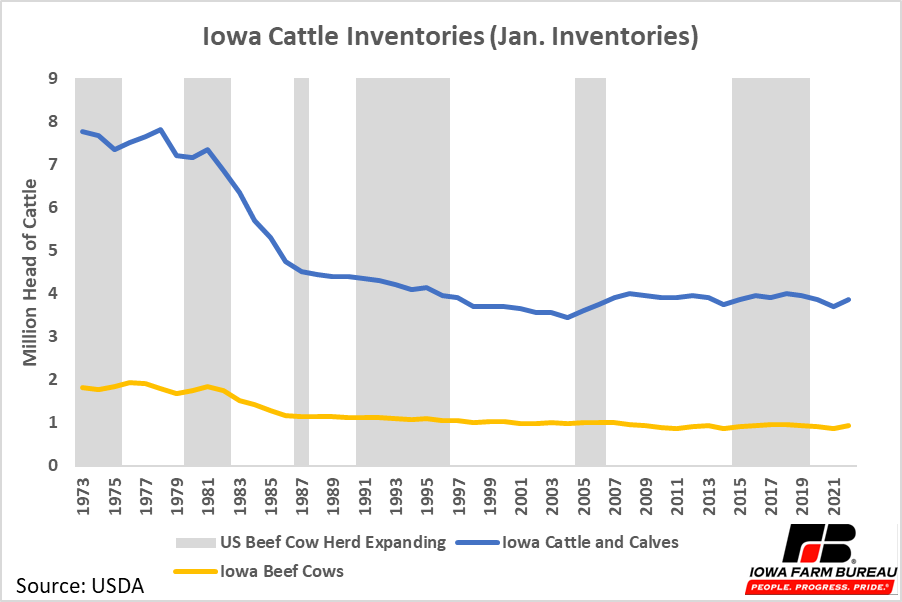
Figure 4. Iowa Cattle and Calves (Jan. Inventories)
The inventory of cattle on feed in the U.S. on July 1, 2022, was 13.4 million (Figure 5). This was no change from the amount of cattle on feed in the U.S. on July 1, 2021. The inventory of cattle on feed in lots with over 1,000 head on July 1, 2022, was 11.3 million. This is a slight increase from July 1, 2021. Cattle on feed in lots with over 1,000 head represent 84.6% of all U.S. cattle on feed. The inventory of cattle on feed typically peaks during periods of herd reduction as more cattle are sent to the feedlot as opposed to being kept as replacements.
Iowa has approximately 1.1 million cattle on feed representing 8% of the cattle on feed in the US. On July 1, 2022, Iowa had 600,000 cattle on feed in lots with over 1,000 head. Approximately 54% of cattle on feed in Iowa are in feedlots of 1000 or more head. This percentage has been increasing over time.
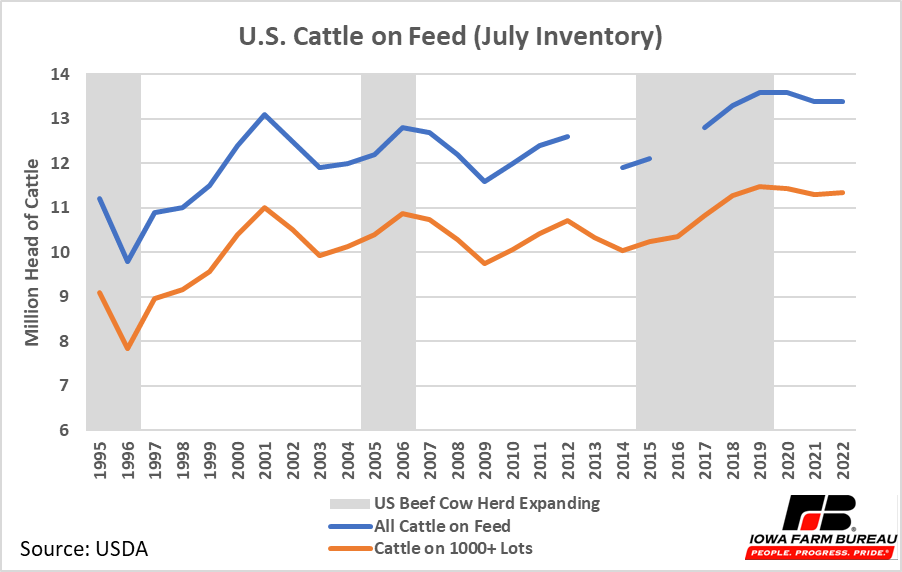
Figure 5. U.S. Cattle on Feed (July Inventory)
U.S. cattle slaughter in June 2022 totaled 3.04 million head (Figure 6). This is a 3% increase compared to June 2021. Through June, total 2022 cattle slaughter is up 1.6% from 2021. Cattle slaughter in 2021 and 2022 has remained relatively stable as opposed to the large drop in cattle slaughtered that occurred in 2020 as a result of the COVID-19 pandemic.
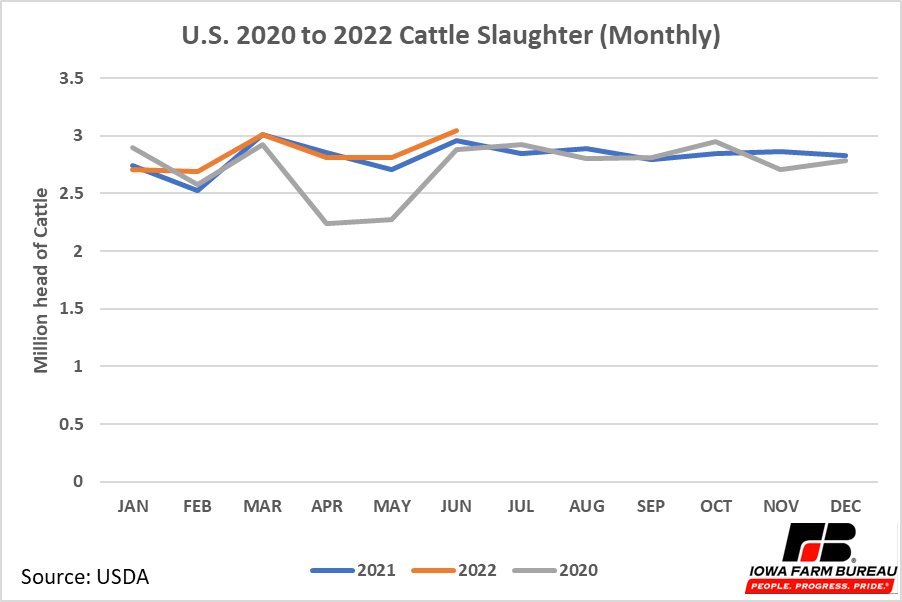
Figure 6. U.S. 2020 to 2022 cattle Slaughter (Monthly)
U.S. cattle slaughter data also follows the cattle cycle (Figure 7). At the beginning of expansion periods, cattle slaughter decreases as more animals are held back as replacements. Then cattle slaughter increases through the expansion period and typically peaks during the period of herd reduction.
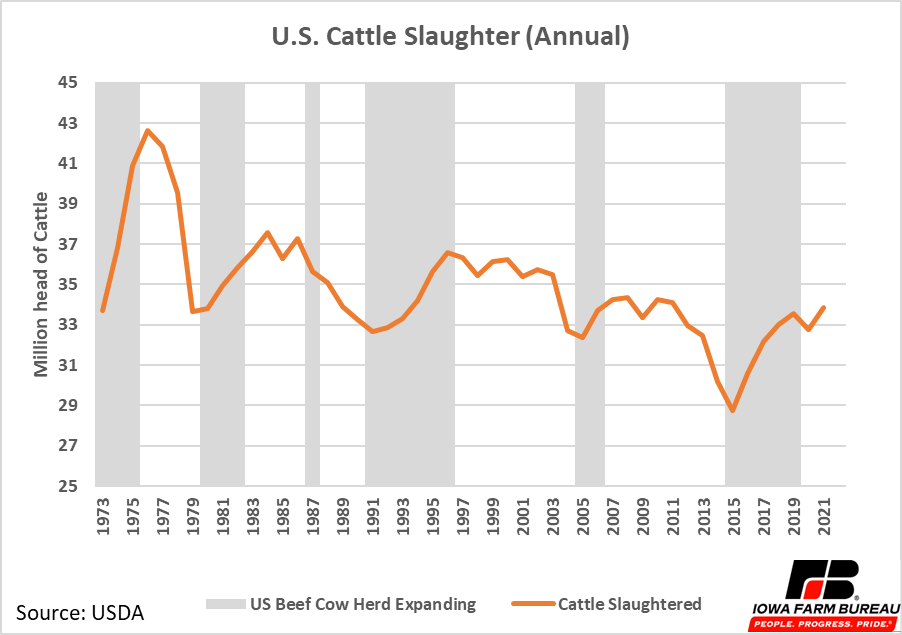
Figure 7. U.S. Cattle Slaughter (Annual)
Average weekly U.S. live cattle prices for beef animals and dairy-beef animals are given in Figure 8. Beef prices have been trending upward since a low point in July 2020.
The U.S. entered a period of herd reduction in 2019 following a period of herd expansion from 2014 to 2018. Typically, prices decrease leading up to a herd reduction. At the beginning of a reduction period, prices continue to decrease further as additional cull cows create additional supply. After excess cows are removed from the herd, prices begin to rise as the number of animals available for slaughter decreases. This price cycle only occurs if no large external factors influence the market such as reduced beef demand or limited slaughter capacity.
The shutdown of meat packing plants during the COVID-19 pandemic was a large external factor that likely influenced prices. Cattle slaughter numbers in April 2020 and May of 2020 were well below typical levels (Figure 6). This reduction in slaughter capacity created excess beef cattle supply, as animals that typically would have been slaughter remained on the market. The reduction in slaughter capacity and associated increase in beef cattle supply likely caused the drop in prices in the summer of 2020 as shown in Figure 8. As the excess supply of cattle was worked through, prices gradually began to rise. The typical price movements associated with the cattle cycle are not easily observed due to distortions created by the COVID-19 pandemic.
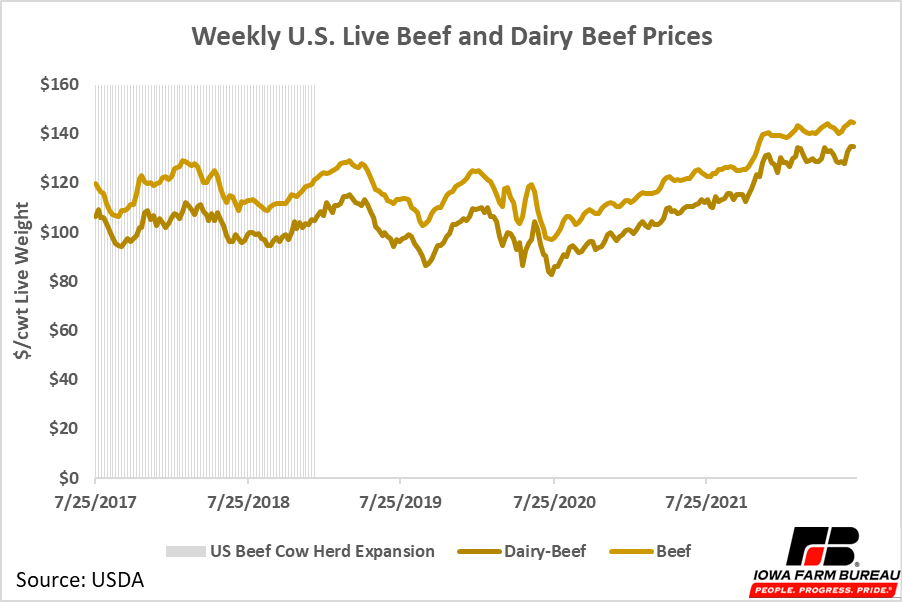
Figure 8. U.S. Live Beef and Dairy Prices (Weekly)
The cattle cycle is not a perfect tool. Other factors such as weather, feed availability, and slaughter capacity also influence cattle inventories and cattle prices by shortening or lengthening a typical cattle cycle. While the cattle cycle is not a perfect tool, it is still an important tool used to understand and predict cattle inventories and prices.
Economic analysis provided by Aaron Gerdts, Research Analyst, Decision Innovation Solutions on behalf of Iowa Farm Bureau.
Want more news on this topic? Farm Bureau members may subscribe for a free email news service, featuring the farm and rural topics that interest them most!