Cattle Market Update
Author
Published
2/3/2023
Highlights
The USDA recently released its semi-annual estimate of January 1 cattle inventories. Total cattle inventory continued its downward trend, falling 3% since last year. All notable categories of cattle were down including cows, replacements, steers and market heifers, bulls, and calves. Beef cow and heifer slaughter have seen no notable decline, so the end of herd liquidation does not appear imminent. Cattle prices have risen as herd inventories have fallen. If inventories continue to fall, more upward movement should be expected on cattle price this year.
Cattle Herd
US beef cow inventories, a driver of future cattle inventories, was 28.9 million, a 4% decline from last year (Figure 1). Beef cow inventories typically follow a roughly ten-year cattle cycle. Periods of expansion are shaded in the graphs in this article for reference. A period of expansion and contraction together make up one cattle cycle.
The inventory of all cattle and calves in the U.S. on July 1, 2022, was 89.3 million head, a 3% decline from last January. This unsurprisingly follows the beef cow cycle, though sometimes at a lag as the cow herd builds up and then total cattle inventory begins to expand.
Beef heifer replacement inventories totaled 5.2 million, down 6% form last year. The continued downward trend of replacements suggests herd liquidation is not likely to end soon.
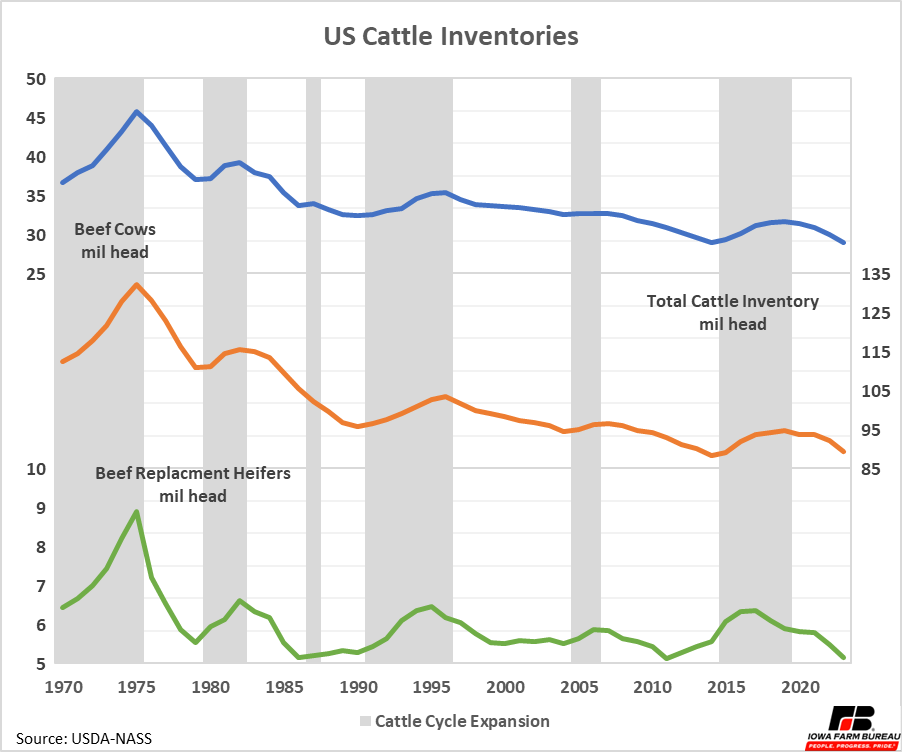
Figure 1. US Cattle Inventories
Herd liquidation is also obvious in Iowa. Iowa’s beef cattle inventory totaled 860,000, a 5% decline from last year (Figure 2). This represents about 3% of the total U.S. beef cow herd. The inventory of all cattle and calves in Iowa was 3.65 million, also a 5% decline was last year. This represents about 4% of all U.S. cattle and calves.
For comparison to the national cattle cycle, gray bars marking expansions of the U.S. beef cow herd are included in Figure 2 as well. In general Iowa cattle inventories have followed the national cycle. The biggest exception occurred from 1990 to 1996 when the U.S. beef cow herd experienced an expansion phase, growing by 9%, while the Iowa beef cow inventories fell 5%.
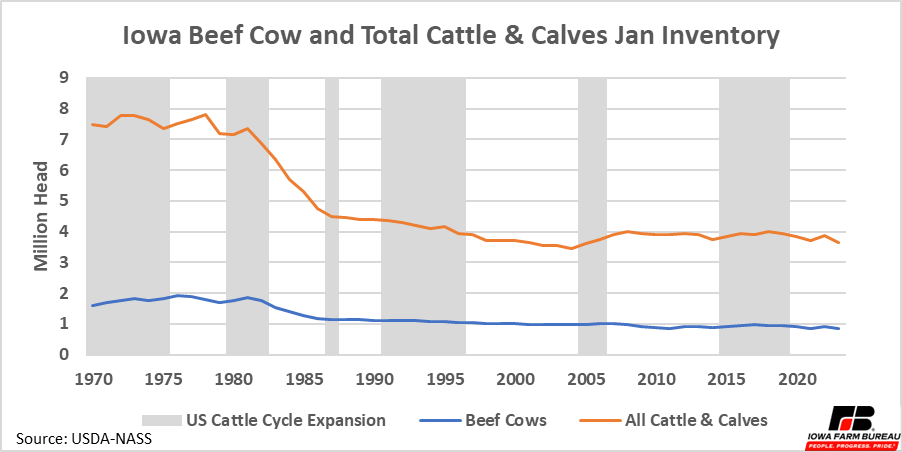
Figure 2. Iowa Beef Cow and Total Cattle & Calves Jan Inventory
Cattle on Feed
The inventory of cattle on feed in the U.S. on January 1, 2023, was 14.2 million, a 4% decline from last year (Figure 3). Feedlots with over 1,000 head of capacity head 11.7 million of these animals, down 3% from last year. About 82% of cattle on feed are in feedlots with over 1,000 head of capacity. Despite lower overall cattle numbers, feedlot inventories have not seen decreased yet.
Iowa held 1.2 million cattle on feed, down 2% from last year. However, cattle on feed in Iowa on lots over 1,000 head increased to 620,000, up 3% compared to last year. In Iowa, the feeding cattle industry, like most industries in agricultural is becoming more consolidated. However, only 54% of Iowa cattle are on lots with over 1,000 head, much less than the national share.
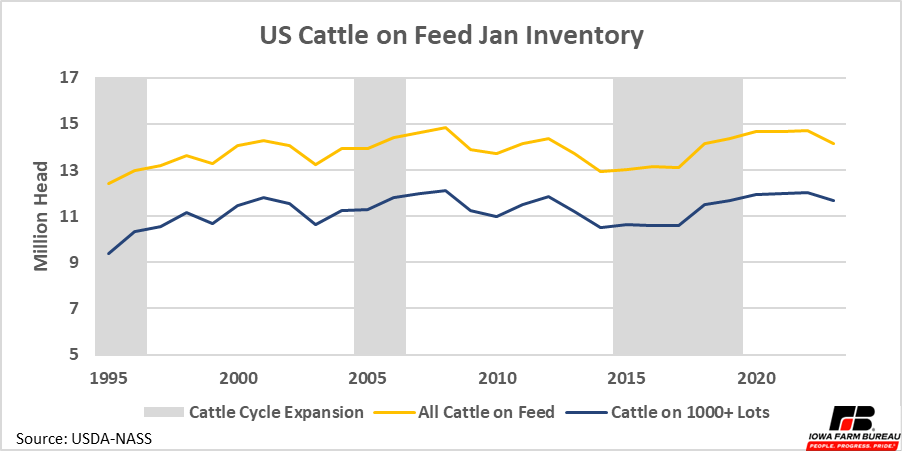
Figure 3. US Cattle on Feed Jan Inventory
Cattle Slaughter
Cattle slaughter was lower in December which is typical as packing plant typically have reduced hours or close over the holidays. Monthly total cattle slaughter sat between 2.5 to 3.0 million head per month in 2022, a typical range since January 2017 (Figure 4).
More interestingly, beef cow and beef heifer slaughter continued their rise as the US herd continues liquidation. Looking at slaughter on an annual basis, steers were down compared to last year, while both beef cow and heifer slaughter was up (Figure 5). Together this suggests the beef herd liquidation is not yet over.
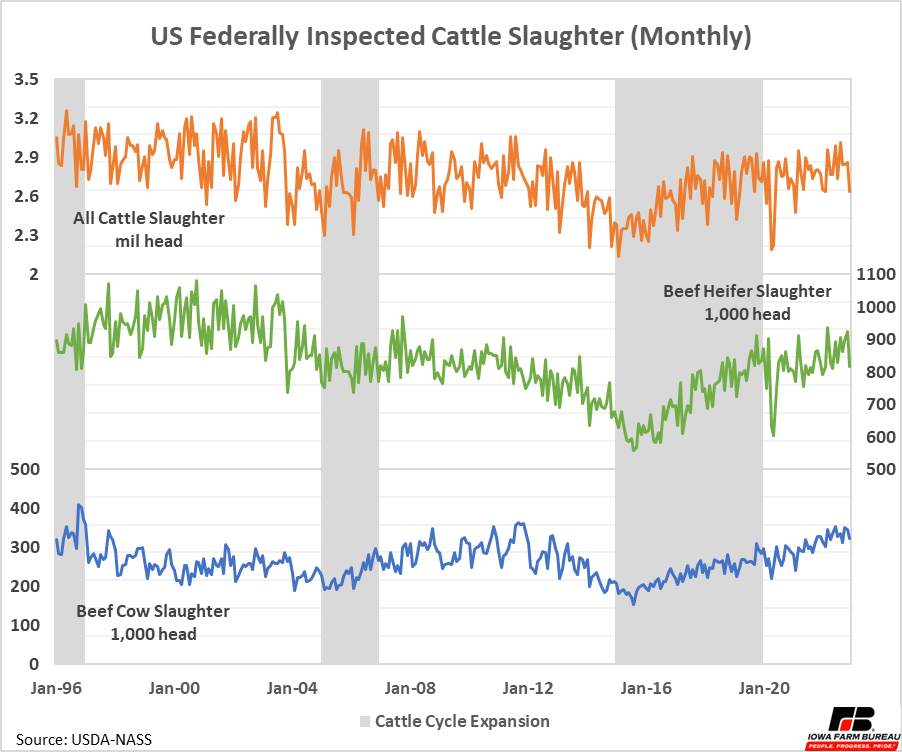
Figure 4. US Federally Inspected Cattle Slaughter (Monthly)
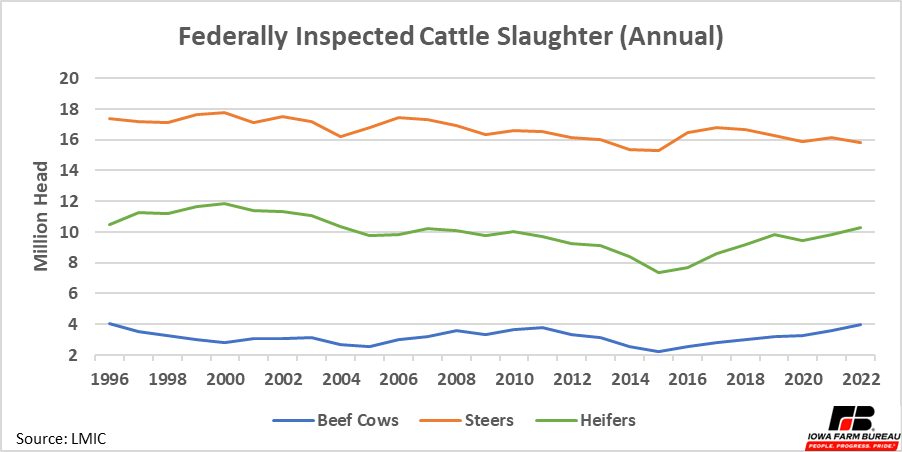
Figure 5. Federally Inspected Cattle Slaughter (Annual)
Cattle Prices
Average monthly futures prices for both feeders and fat cattle are shown in Figure 6. Beef prices have been trending upward since a recent low point in April 2020. The extreme low point in April 2020 was due to the pandemic, which caused packing plant shutdowns lowering demand and raising supply of fat cattle. However, since then cattle prices have worked their way up as US cattle inventories have been reduced.
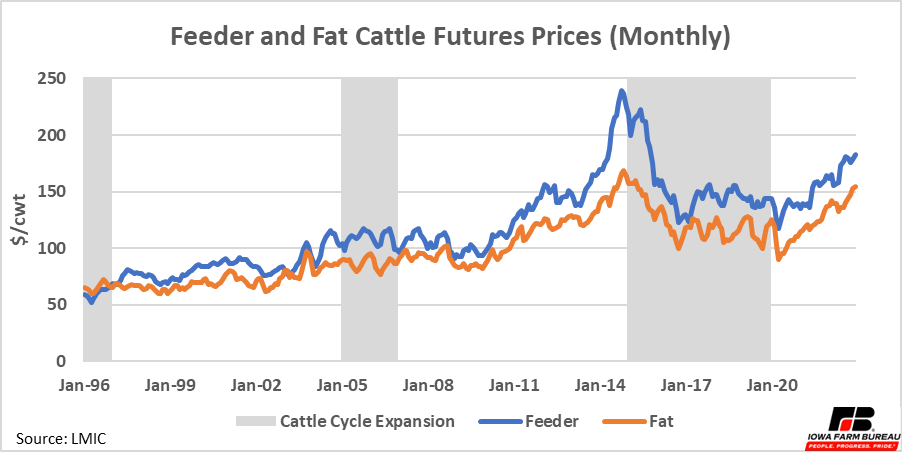
Figure 6. Feeder and Fat Cattle Futures Prices (Monthly)
Iowa and Minnesota fat cattle prices follow futures typically follow futures prices (Figure 7). The basis fluctuates based on a variety of market factors by on average is near the futures price. Over the last few years basis levels have been higher (more positive) than in the past.
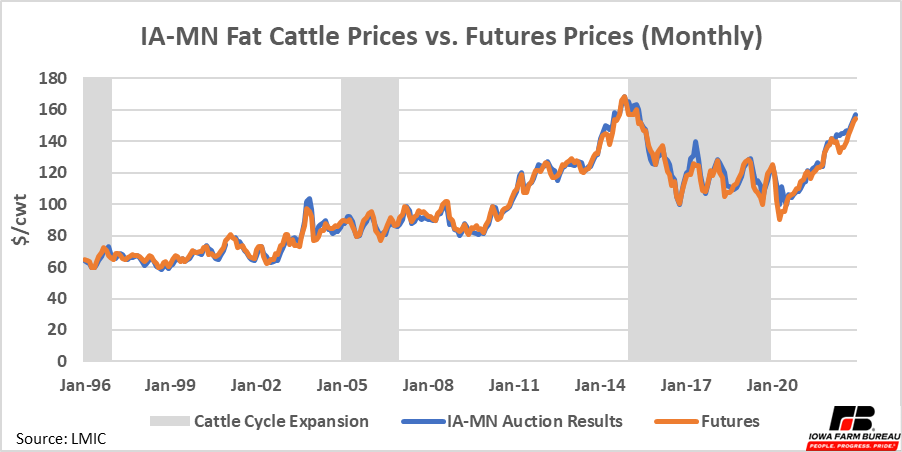
Figure 7. IA-MN Fat Cattle Prices vs. Futures Prices (Monthly)
Conclusion
Cattle inventories continue to work lower as the US continues the herd liquidation phase of its current cattle cycle. Beef cow and heifer slaughter continued to show an upward trend indicating the liquidation phase is not going to end soon. So far cattle prices have worked higher as cattle inventories have decreased. If herd liquidation continues, even more upward pressure will be put on cattle prices moving forward.
A question looking ahead is just how far cattle inventories will fall. Typically, cattle inventories begin to expand when producers see profitable prices. Despite higher prices, inventories still fell over the last year. Factors other than cattle prices like weather and reduced feed availability and the relatively high cost of feed contributed to herd liquidation this past year.
It will be interesting to see if current prices will be high enough to provoke herd expansion or if producers continue to liquidate because they do not have confidence current prices will last, they simply do not have enough feed or usable pasture to support herd expansion this year.
If and when the herd begins to expand again will likely impact how long high cattle and beef prices go and how long they remain at higher levels.
Economic analysis provided by Aaron Gerdts, Research Analyst, Decision Innovation Solutions on behalf of Iowa Farm Bureau.
Want more news on this topic? Farm Bureau members may subscribe for a free email news service, featuring the farm and rural topics that interest them most!