April 2026 WASDE Update
Author
Published
4/13/2026
The USDA released its updated WASDE report on April 9th, 2026.
(Current) 2025/26 Marketing Year
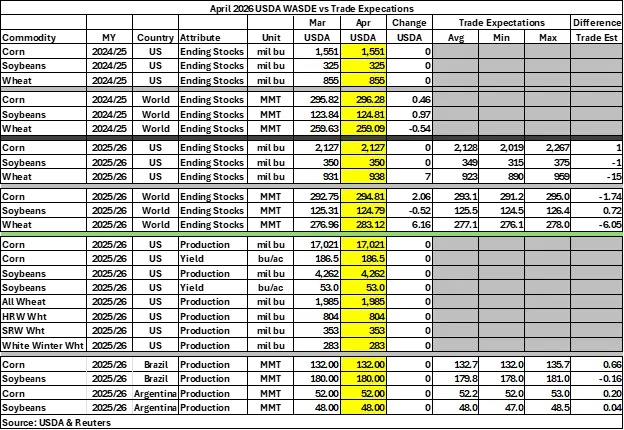
Adjustments to the USDA/s supply and demand estimates were minimal for U.S. ending stocks and production, but world markets saw ending stocks shift. U.S. wheat ending stocks increased by 8 million bushels (mb) to 938 mb and exceeded expectations by 15 mb. U.S. corn and soybean ending stocks remain unchanged and aligned with industry expectations.
World corn ending stocks rose by 2.06 million metric tons (MMT) to 294.81 MMT, slightly beating expectations by 1.74 MMT. World soybean ending stocks dipped by 0.52 MMT to 124.79 MMT and aligned with trade expectations. World wheat ending stocks increased by 6.12 MMT to 283.12 MMT, surpassing expectations by 6.05 MMT.
(Prior) 2024/25 Marketing Year
U.S. corn, soybean, and wheat ending stocks, production, and yield estimates remain unchanged.
World corn and soybean ending stocks both marginally increased to 296.28 MMT and 124.81 MMT respectively, but world wheat stocks slightly fell by 0.54 MMT to 259.09 MMT.
South American Markets
The USDA’s Brazil and Argentina corn and soybean production estimates remain unchanged in the April WASDE. The Brazilian soybean production estimate was 0.16 MMT above trade expectations. Brazilian corn was 0.66 MMT less than average trade expectations and Argentinian corn and soybean production estimates were 0.20 MMT and 0.04 MMT less than trade expectations respectively.
Table 1 shows some key report estimates for both U.S. and World production.
Table 1. April 2026 USDA WASDE
Initial Market Reaction
The downward trend of corn futures continued after the WASDE was released. The immediate market reaction saw May corn futures fall by 2 cents to $4.43 before falling another cent and eventually rising to $4.44. July corn futures fell by 2 cents to $4.54. It fell another cent before recovering to $4.55. September corn futures followed the same trend, initially dipping 2 cents to $4.58, before gaining a cent to $4.59.
Soybean futures initially fell by 4 cents before partially recovering losses. May soybean futures first fell to $11.63 then rose to $11.64. July soybean futures initially decreased by 4 cents to $11.79, then fell another 2 cents before recovering to $11.79 as of 2:00pm CST. August soybean futures followed a similar trend, first falling to $11.74 then decreasing another 2 cents before returning to $11.74.
Soybean meal futures were trending upwards prior to the release of this month’s WASDE. May soybean meal futures initially fell by $1/ton to $317.0/ton. July and August soybean meal futures followed the same trend, falling $1/ton to $316.0/ton and $313.9/ton respectively.
The immediate market reaction saw soybean oil futures continue today’s downward trend, with prices initially falling by 0.26-0.28 cents per pound. May soybean oil futures first fell to 67.69 cents per pound and continued to decrease. July soybean oil futures fell to 67.53 cents per pound and August soybean oil futures dipped to 66.52 cents per pound.
Wheat futures were already down 13 cents prior to the WASDE being released. May wheat futures continued that trend, initially falling another 5 cents to $5.70 before slowly recovering to $5.73. July wheat futures immediately decreased by 5 cents to $5.80 before slowly rising to $5.84. September wheat futures initially fell by 5 cents to $5.93 but recovered to $5.97.
Changes to Domestic Balance Sheets
This section summarizes changes to the corn and soybean balance sheets in more detail.
For corn, there were no changes in the 2024/25 balance sheet. The only change in the 2025/26 balance sheet is expected farm price bushel increasing by $0.05 to $4.15 a bushel.
Table 2. April 2026 WASDE Corn Balance Sheet

For soybeans, there were no changes in the 2024/25 balance sheet. For the 2025/26 balance sheet, 35 mb shifted from exports to crush. Crush rose to 2,610 mb and exports fell to 1,540 mb. Expected average farm price per bushel increased by $0.10 to $10.30 a bushel.
Table 3. April 2026 WASDE Soybean Balance Sheet

Want more news on this topic? Farm Bureau members may subscribe for a free email news service, featuring the farm and rural topics that interest them most!