Utilizing crop progress good and excellent condition ratings for forecasting Iowa corn and soybeans yield – Part 3
Published
1/24/2019
In this series of articles, we studied the relationship between the crop progress Good and Excellent condition ratings and the corn and soybean yields for the State of Iowa from 1986 to 2018. The final condition rating is a good predictor to forecast the Trend Adjusted (TA) Yield for both corn and soybeans; to have more details check the first article of the series. From Week 32, the weekly condition ratings for Iowa corn could have a relatively accurate TA yield prediction for corn in the State of Iowa. And from Week 38, the ratings could provide a TA yield prediction as accurate as using the final ratings for soybeans in Iowa; more details are in the second article of this topic.
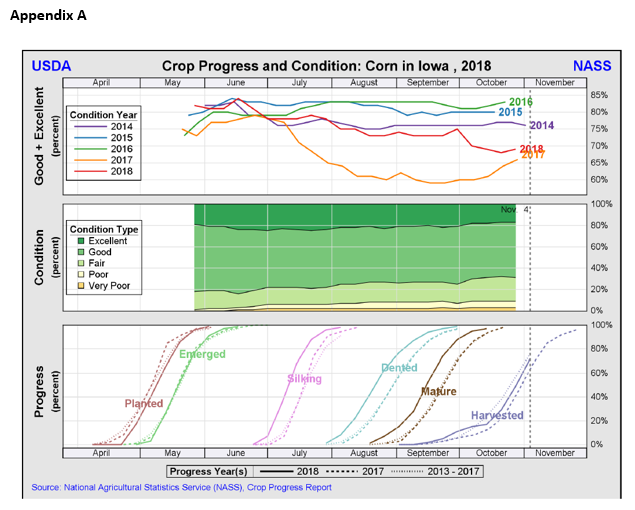
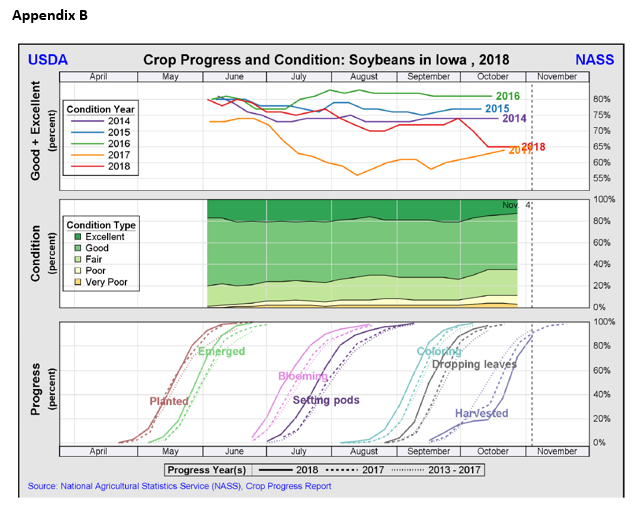
While doing the analyses, we noticed that the good and excellent condition ratings in the first week of many growing seasons are relatively higher than the final good and excellent condition ratings. First week ratings are higher than the final week ratings in 17 out of 33 years for corn, and the first week ratings are higher than the final week’s rating in 20 out of 33 years for soybeans. The condition ratings in a five-year history (from 2014 to 2018) are shown in Appendix A and Appendix B for Iowa corn and Iowa soybeans, respectively. This pattern was also observed at the national level from a Farmdoc Daily’s study.
“In most years, corn and soybean crops emerge in a normal fashion and actual yields end up being near normal or better in most years”, said by Irwin and his colleague [1]. That means good crop outcomes happened more often than the bad outcome over years, so people expected higher condition ratings in the first week of the next growing season. And in a few years with extreme weather, like the years of 1988, 1993 and 2012, the final crop condition ratings dropped dramatically from the first week’s condition ratings. Plus, the agriculture practices have highly improved within the last decade. These factors lead to the higher first week condition ratings compared to the final week ratings.
In the national study [1], Irwin and Good mentioned that after the year of 1999, the differences between the first to final ratings (First ratings minus Final ratings) had increased for both corn and soybeans. The average change for U.S. corn was from over-estimated by 1.2% from 1986 to 1998 to over-estimated by 7.6% from 1999 to 2016. And the average change for U.S. soybean conditions was from over-estimated 1.8% in the earlier time interval to over-estimated 10.5% in the latter time interval. Unfortunately, the exact reason for the trend and structural change observed beginning in 1999 are unknown. So, we want to examine whether it shows the same pattern and structure for corn and soybeans in the State of Iowa. Results are shown in Figure 1 and Figure 2 for corn and soybeans respectively.
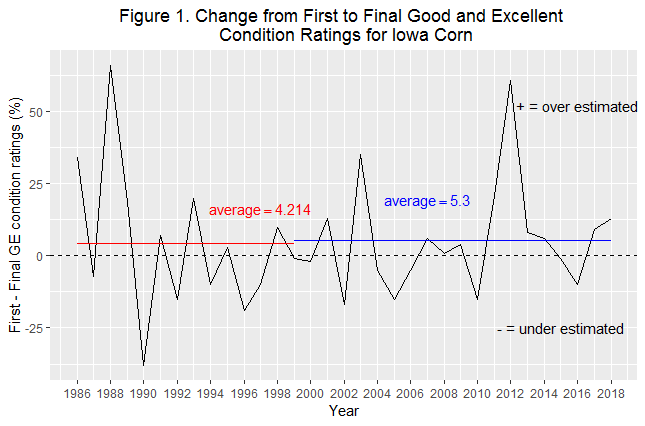
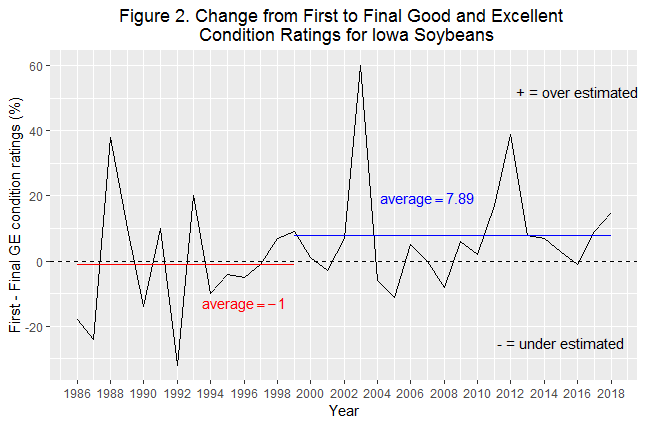
In Figure 1, for Iowa corn, the average change of the first week to the final week good and excellent condition ratings increases 1.086 points, from 4.214% within 1986 to 1998 period, to 5.3% within 1999 to 2018 period. In Figure 2, for soybeans, the average change of first to final week ratings increases from -1 point in the earlier time interval to 7.89 points in the latter time interval. There are 1.086 points increasing for corn, and 8.89 points increasing for soybean, but by doing a Wilcoxon test*, with p = 0.81 for corn and p = 0.16 for soybeans, there are no significantly differences for both crops, statistically speaking. *Wilcoxon test, aka, Wilcoxon signed rank test, is a non-parametric statistical hypothesis test to compare two related samples whether their population distributions normally distributed [2].
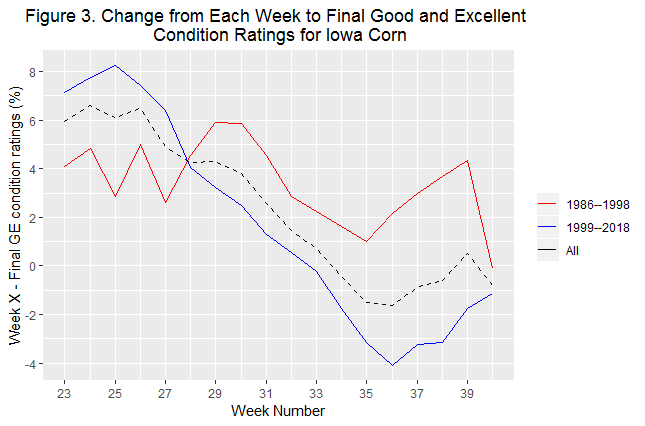
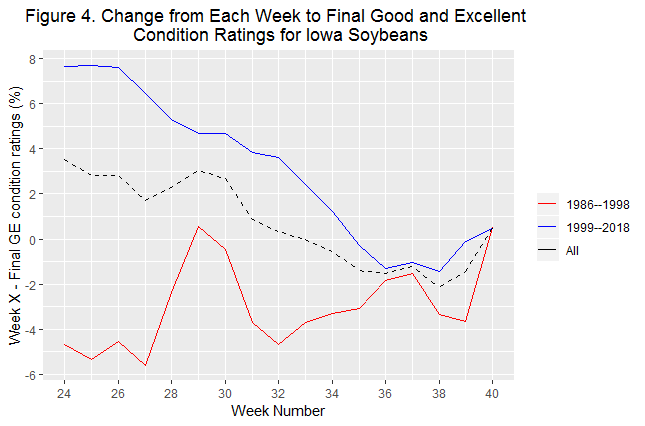
Although the means of change in the percentage of good and excellent crop condition ratings for the first week to final week from different time periods are not significantly different, the trends of changing in percentage of condition ratings for each week and the final ratings of the season totally vary, shown in Figure 3 and Figure 4 for corn and soybeans, respectively. In both plots, the red line represents the changing of condition ratings for each week and a final week from 1986 to 1998, the blue line represents the changing from 1999 to 2018, and the black dash line represents the average changing of the entire study period. As shown in the two figures, the structure of red lines is totally different compared to the structure of blue lines.
In Figure 3, for the red line, all the differences between each week’s condition rating and final condition rating are larger than zero, that means from 1986 to 1998, all the condition ratings in the final week of the growing season were the lowest. For the blue line, from the year of 1999 to the year of 2018, before week #32, averaged weekly rating was higher than the averaged final rating; while from week #33, showed the opposite way, weekly ratings lower than the final ratings. The week of 33 for corn growing season is about getting into the mature stage, shown in Appendix A.
In Figure 4, almost all the weekly condition ratings are lower than the final ratings from 1986 to 1988, except week #29 and week #40, shown in red line. But from 1999 to 2018, almost all the weekly condition ratings are larger than the final ratings, except from week #35 to week #39. And from the week 35 to week 39, is close to soybean dropping leaves period, shown in Appendix B. For both crops, the pattern and structure of red line and blue line changed dramatically, which is the reason we separated the study period into two groups by the year of 1999 for the first article in this series. Unfortunately, we don’t yet know the reason why the structure of average difference/bias changed completely (Figures 3 & 4).
Reference
[1] Scott Irwin and Darrel Good, How Should We Use Within-Season Crop Condition Ratings for Corn and Soybean, Farmdoc Daily (7): 101., June 1, 2017.
[2] Frank Wilcoxon, Individual Comparisons by Ranking Methods, Biometrics Bulletin. 1(6): 80-83., December 1945.
[3] Scott Irwin and Todd Hubbs, What to Make of High Early Season Crop Condition Ratings for Corn, Farmdoc Daily (8): 108., June 13, 2018.
[4] Scott Irwin and Todd Hubbs, What to Make of High Early Season Crop Condition Ratings for Soybeans, Farmdoc Daily (8): 109., June 14, 2018.
Jing Tang, Statistician, Decision Innovation Solutions (DIS). DIS is an Iowa-based economic research firm which provides regular farm economic research for Iowa Farm Bureau staff & members.
Want more news on this topic? Farm Bureau members may subscribe for a free email news service, featuring the farm and rural topics that interest them most!