November WASDE: USDA Cuts 2026/27 Corn Ending Stocks 91 Million Bushels to 1.76 Billion
Author
Published
11/10/2026
WASDE
USDA's November 10, 2026 World Agricultural Supply and Demand Estimates (WASDE-677) lowered projected 2026/27 U.S. corn ending stocks 91 million bushels to 1,758 million, as a smaller crop outweighed lower feed and export use. Soybean ending stocks fell 15 million bushels to 300 million, and wheat ending stocks rose 3 million to 743 million. USDA lowered the season-average corn price $0.10 to $4.60 per bushel and raised the soybean price $0.10 to $12.10.
Corn
USDA lowered 2026/27 corn production 141 million bushels to 15,893 million on a 1.6-bushel cut in yield to 179.6 bu/ac, with harvested area unchanged at 88.5 million acres. Beginning stocks are unchanged at 2,095 million bushels, so supplies fell 141 million to 18,013 million. “With a smaller crop,” feed and residual use was lowered 25 million bushels to 5,975 million, and exports were cut 25 million to 3,275 million “reflecting shipments and sales to date.” Total use fell 50 million bushels to 16,255 million. Ending stocks of 1,758 million bushels put stocks-to-use at 10.8%, down from 11.3% in October. USDA lowered the season-average price $0.10 to $4.60 per bushel even as ending stocks tightened, and gave no reason in the report.
This month's change is all new crop. By the desk's arithmetic, the 141-million-bushel smaller crop, partly offset by 50 million bushels less use, accounts for the full 91-million-bushel drop in ending stocks; beginning stocks did not move.
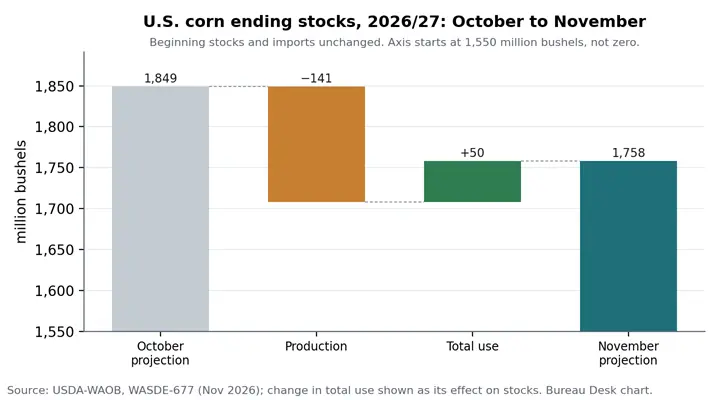
Figure 1. U.S. corn ending stocks for 2026/27, October to November projection, by source of the change (million bushels). Source: USDA-WAOB, WASDE-677, November 10, 2026
For 2025/26, USDA made only offsetting adjustments: feed and residual use was lowered 1 million bushels to 6,118 million and ethanol use raised 1 million to 5,548 million, leaving total use at 16,451 million and ending stocks unchanged at 2,095 million.
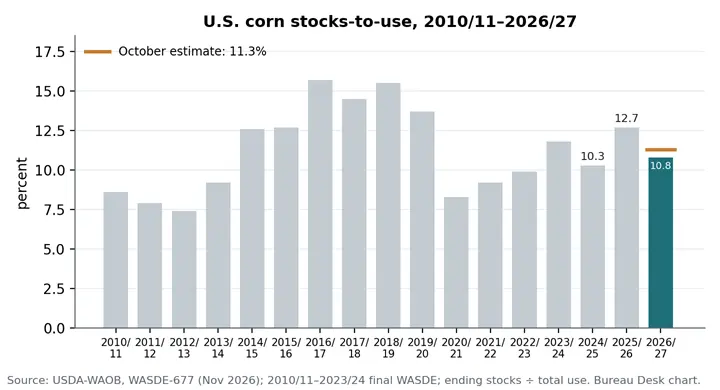
Figure 2. U.S. corn stocks-to-use ratio by marketing year, with the October estimate marked (percent). Source: USDA-WAOB, WASDE-677, November 10, 2026; earlier years from final WASDE estimates; stocks-to-use is the desk's calculation
World 2026/27 corn ending stocks rose 1.50 million metric tons to 281.94 million, and USDA attributes the rise in global coarse grain stocks primarily to larger corn inventories for Ukraine and China. South American crops were raised: Argentina's 2026/27 corn production was raised 2.0 million tons to 57.0 million “on above average planting progress that indicates expanded area,” with its exports up 2.0 million to 40.0 million. Brazil's 2026/27 corn crop was raised 2.0 million tons to 141.0 million on larger first-crop area, and its 2025/26 crop 3.5 million to 144.5 million.
Item | 2025/26 Nov | Change | 2026/27 Oct | 2026/27 Nov | Change |
Area harvested (mil. ac) | 90.9 | 0 | 88.5 | 88.5 | 0 |
Yield (bu/ac) | 186.5 | 0 | 181.2 | 179.6 | -1.6 |
Beginning stocks | 1,551 | 0 | 2,095 | 2,095 | 0 |
Production | 16,964 | 0 | 16,034 | 15,893 | -141 |
Total supply | 18,546 | 0 | 18,154 | 18,013 | -141 |
Feed and residual | 6,118 | -1 | 6,000 | 5,975 | -25 |
Food, seed and industrial | 6,904 | +1 | 7,005 | 7,005 | 0 |
Ethanol | 5,548 | +1 | 5,650 | 5,650 | 0 |
Exports | 3,429 | 0 | 3,300 | 3,275 | -25 |
Total use | 16,451 | 0 | 16,305 | 16,255 | -50 |
Ending stocks | 2,095 | 0 | 1,849 | 1,758 | -91 |
Avg. farm price ($/bu) | 4.16 | 0 | 4.70 | 4.60 | -0.10 |
Table 1. U.S. corn supply and use, million bushels unless noted. Source: USDA-WAOB, WASDE-677, November 10, 2026; changes from WASDE-676.
Soybeans
USDA raised 2026/27 soybean production 12 million bushels to 4,574 million on a yield of 53.3 bu/ac, up 0.2 bushel from October, with harvested area unchanged at 85.9 million acres; USDA credits higher yields in Minnesota, Iowa, South Dakota and Nebraska. Exports were raised 25 million bushels to 1,720 million “based on larger supplies and early season export pace,” seed use was raised 3 million, residual lowered 1 million, and crush is unchanged at 2,780 million. Total use rose 27 million bushels to 4,614 million, and ending stocks fell 15 million to 300 million, putting stocks-to-use at 6.5%, down from 6.9% in October. The season-average price was raised $0.10 to $12.10 per bushel.
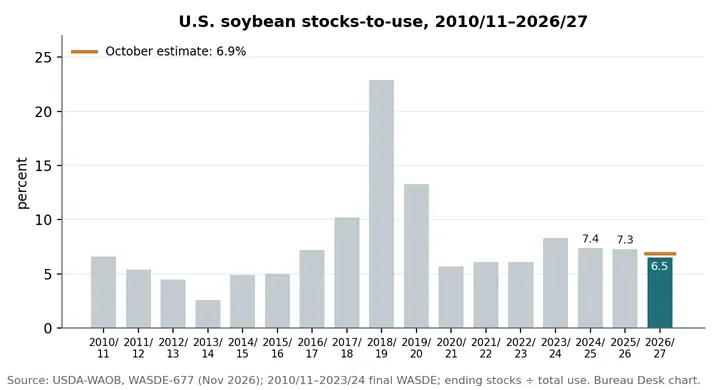
Figure 3. U.S. soybean stocks-to-use ratio by marketing year, with the October estimate marked (percent). Source: USDA-WAOB, WASDE-677, November 10, 2026; earlier years from final WASDE estimates; stocks-to-use is the desk's calculation
The 2025/26 soybean balance sheet is unchanged, with ending stocks at 315 million bushels. World 2026/27 soybean ending stocks fell 0.78 million metric tons to 123.50 million, mainly on lower stocks for the United States and Argentina. Argentina's 2026/27 crop is unchanged at 50.0 million tons, but its exports were raised 0.3 million tons to 6.75 million and its ending stocks lowered 0.33 million to 23.74 million. Brazil's soybean estimates are unchanged for both years, at 180.5 million tons for 2025/26 and 186.0 million for 2026/27.
Item | 2025/26 Nov | Change | 2026/27 Oct | 2026/27 Nov | Change |
Area harvested (mil. ac) | 80.4 | 0 | 85.9 | 85.9 | 0 |
Yield (bu/ac) | 53.0 | 0 | 53.1 | 53.3 | +0.2 |
Beginning stocks | 325 | 0 | 315 | 315 | 0 |
Production | 4,261 | 0 | 4,562 | 4,574 | +12 |
Imports | 22 | 0 | 25 | 25 | 0 |
Total supply | 4,608 | 0 | 4,902 | 4,914 | +12 |
Crushings | 2,646 | 0 | 2,780 | 2,780 | 0 |
Exports | 1,515 | 0 | 1,695 | 1,720 | +25 |
Total use | 4,293 | 0 | 4,587 | 4,614 | +27 |
Ending stocks | 315 | 0 | 315 | 300 | -15 |
Avg. farm price ($/bu) | 10.50 | 0 | 12.00 | 12.10 | +0.10 |
Table 2. U.S. soybean supply and use, million bushels unless noted. Source: USDA-WAOB, WASDE-677, November 10, 2026; changes from WASDE-676.
Wheat
Projected 2026/27 wheat ending stocks rose 3 million bushels to 743 million, still 19.2% below 2025/26. The change is on the use side: food use was lowered 3 million bushels to 957 million after the NASS Flour Milling Products report showed a 2 percent year-to-year decline in wheat ground for flour in the July–September quarter. Production is unchanged at 1,534 million bushels and exports are unchanged at 750 million, though USDA raised white wheat exports on strong sales and lowered hard red winter exports on weak sales. By class, hard red winter ending stocks rose 11 million bushels to 344 million and white ending stocks fell 10 million to 70 million. The season-average farm price was lowered $0.10 to $6.20 per bushel. World 2026/27 wheat ending stocks rose 4.78 million metric tons to 280.82 million.
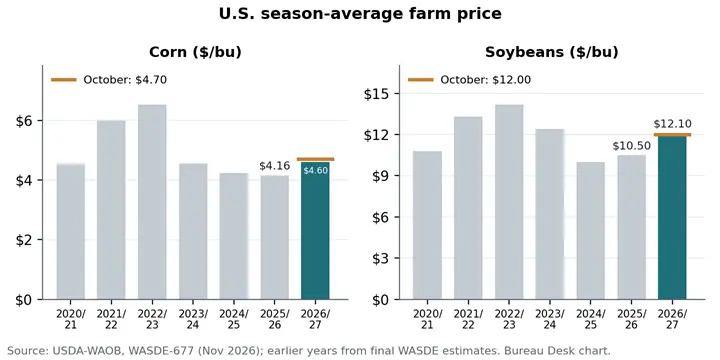
Figure 4. U.S. season-average farm price for corn and soybeans by marketing year ($ per bushel). Source: USDA-WAOB, WASDE-677, November 10, 2026; earlier years from final WASDE estimates
Market reaction
December 2026 corn futures closed at $4.49, up 9¾ cents from the November 9 settlement, after a $4.55½ high. January 2027 soybeans closed at $12.28, up 39¾ cents.
Source: USDA-WAOB, World Agricultural Supply and Demand Estimates, WASDE-677, released November 10, 2026.
Want more news on this topic? Farm Bureau members may subscribe for a free email news service, featuring the farm and rural topics that interest them most!