Quarterly Hog Inventory Shows Low Sow Numbers Presist
Author
Published
12/27/2023
Introduction
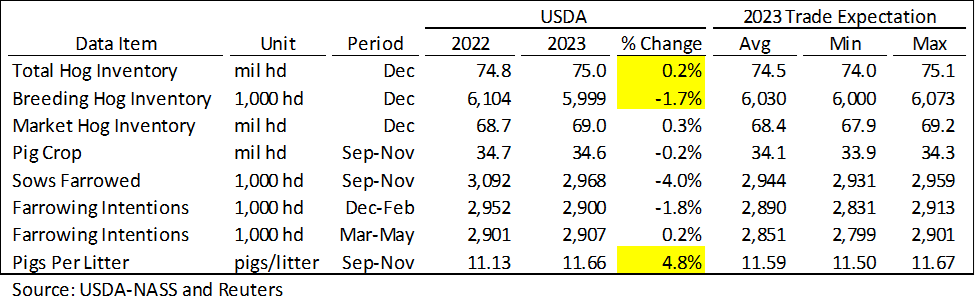
The USDA released its quarterly estimate of the inventory of all hogs and pigs in the U.S. on December 22, 2023. All estimates are for December 1st or the Sep-Nov quarter unless otherwise noted. Table 1 shows key estimates at the US level as well as trade expectations.
Changes of particular interest are highlighted. Notice: Total hog inventory was relatively unchanged. However, breeding hog inventory decreased 1.7% year-over-year. This was offset by higher litter rates obtained from the sows that were kept. This trend has occurred in the previous two quarters are well. One reason this could be occurring is the least productive sows are the ones being culled from herds, raising the average genetic potential of the sows left in the herd. This trend is apt to continue as long as producers are under financial pressure from low hog margins.
Relative to trade estimates, total inventories were high and breeding hog inventory was low. Litter rates were slightly higher than analysts’ estimates, but still within the range projected.
Table 1. 2023 December Hog Report Statistics for the US
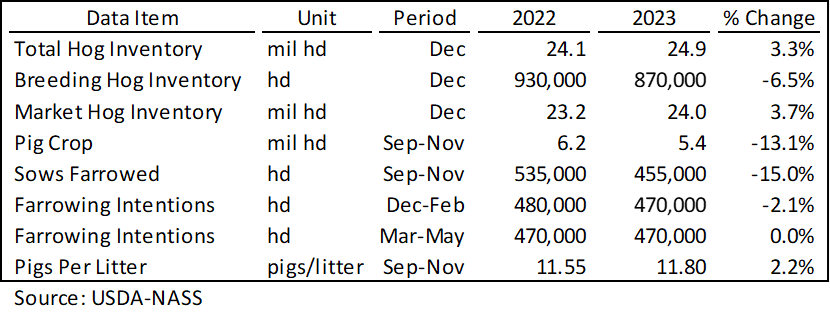
Statistics for Iowa were also included in the report (Table 2). In general, Iowa trends followed US trends, with a smaller breeding herd and larger litter rate. A few differences are that Iowa’s market herd showed more growth on a percentage basis than the US herd. Also, Iowa’s litter rate was above the US litter rate, which has been typically.
Table 2. 2023 December Hog Report Statistics for the Iowa
Again, Fewer Sows but More Pigs
As mentioned above, the US breeding herd decreased year-over year. The breeding herd has been declining since 2019, however, the reported decline this past quarter has been the most significant drop yet (Figure 1). Despite the relatively large drop in hog inventories, total hogs farrowed in the previous quarter was in line with previous quarters (Figure 2).
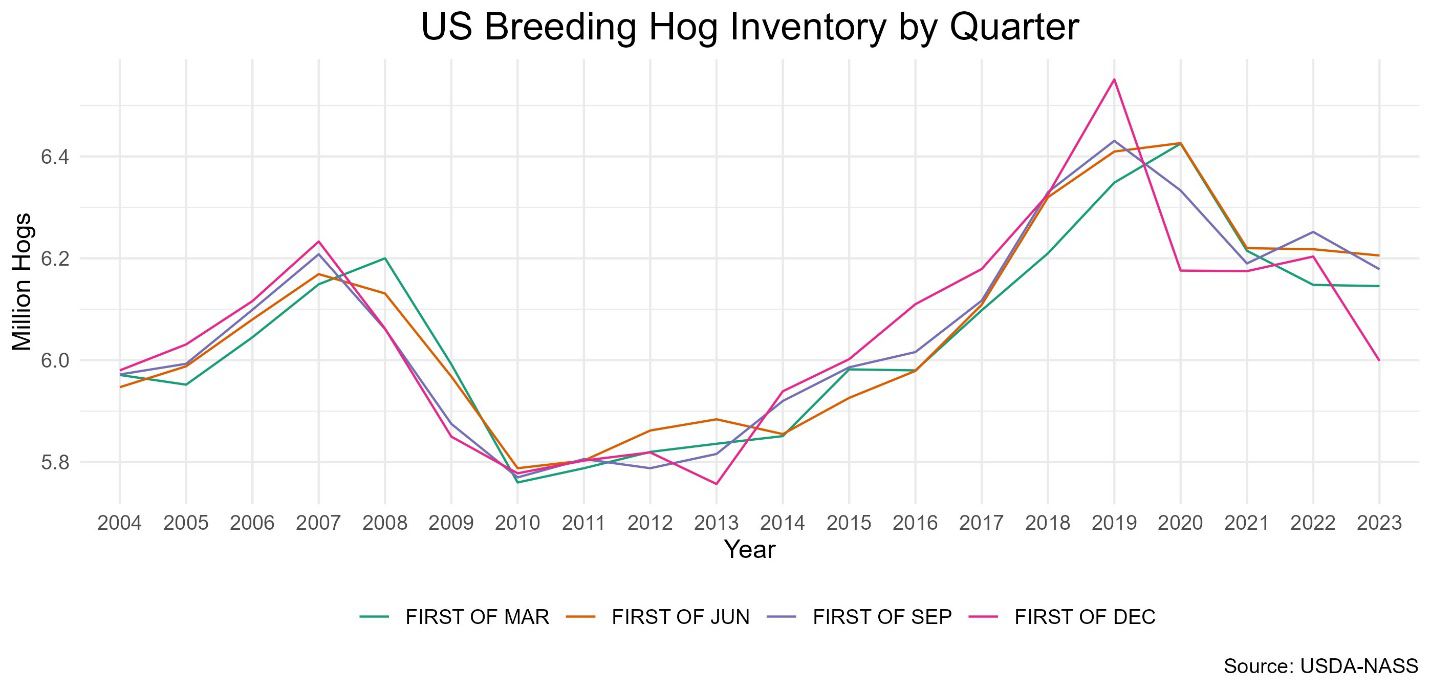
Figure 1. US Breeding Hog Inventory by Quarter
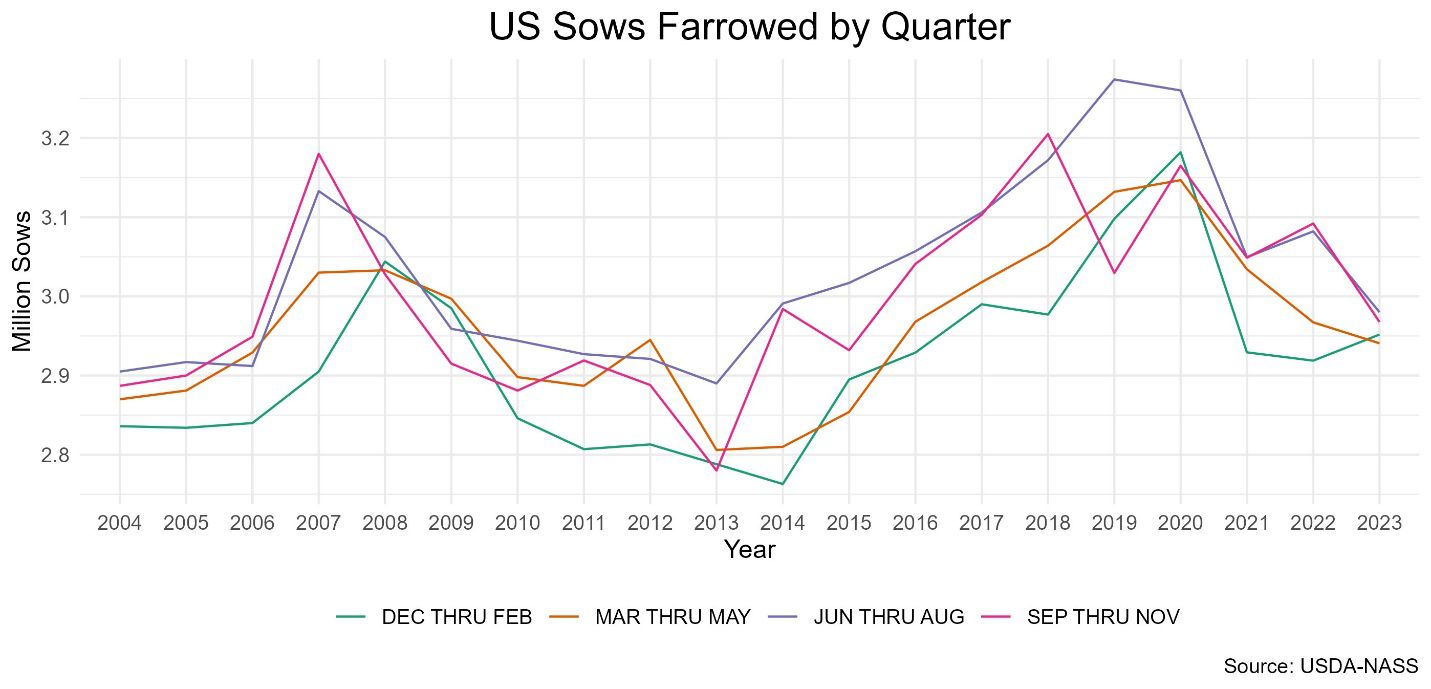
Figure 2. US Sows Farrowed by Quarter
While the breeding herd has continued to decrease, the pig crop has continued to hold steady (Figure 3). This is due to strong litter rates, as the past 3 quarter average litter rates, have all been records (Figure 4). As mentioned above, the declining sow herd is likely contributing to higher litter rates. As the breeding herd decreases, typically it is from the culling of the least productive sows. Removing less productive animals from the herd, increases the average productivity of the entire herd.
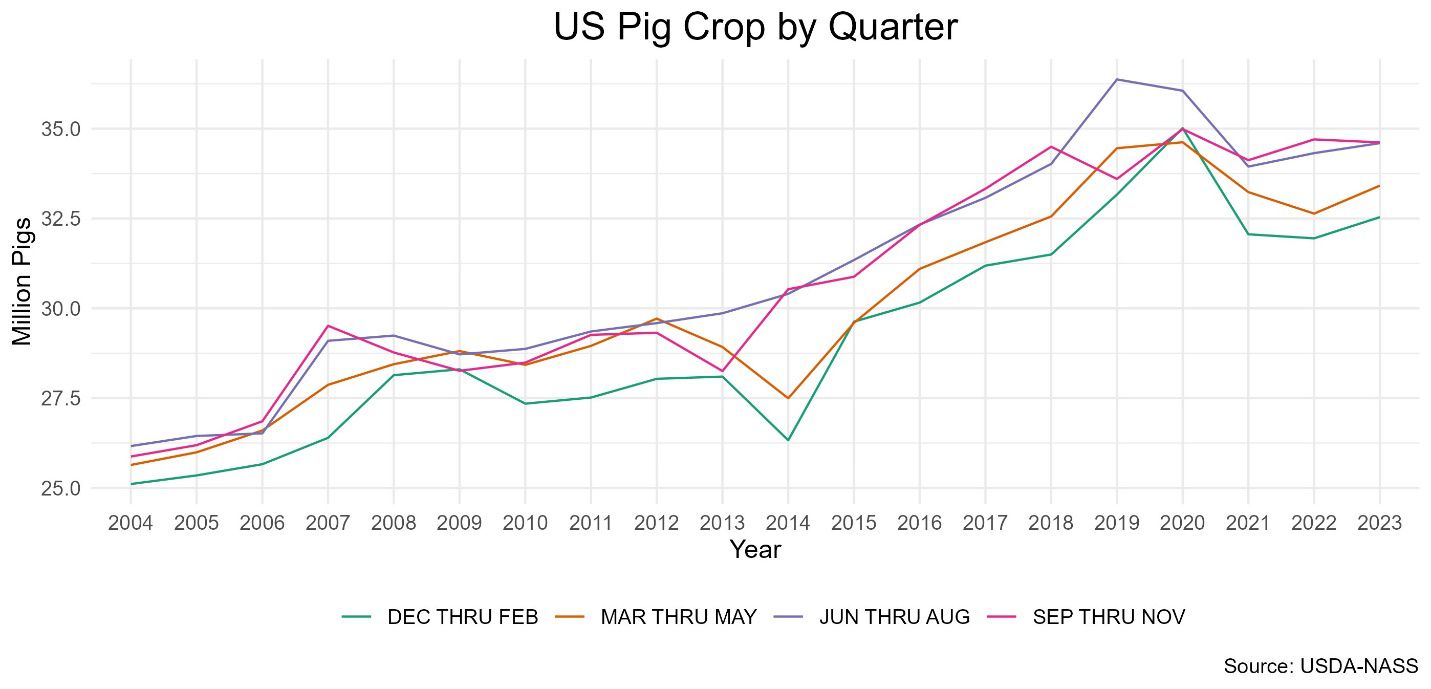
Figure 3. US Pig Crop by Quarter
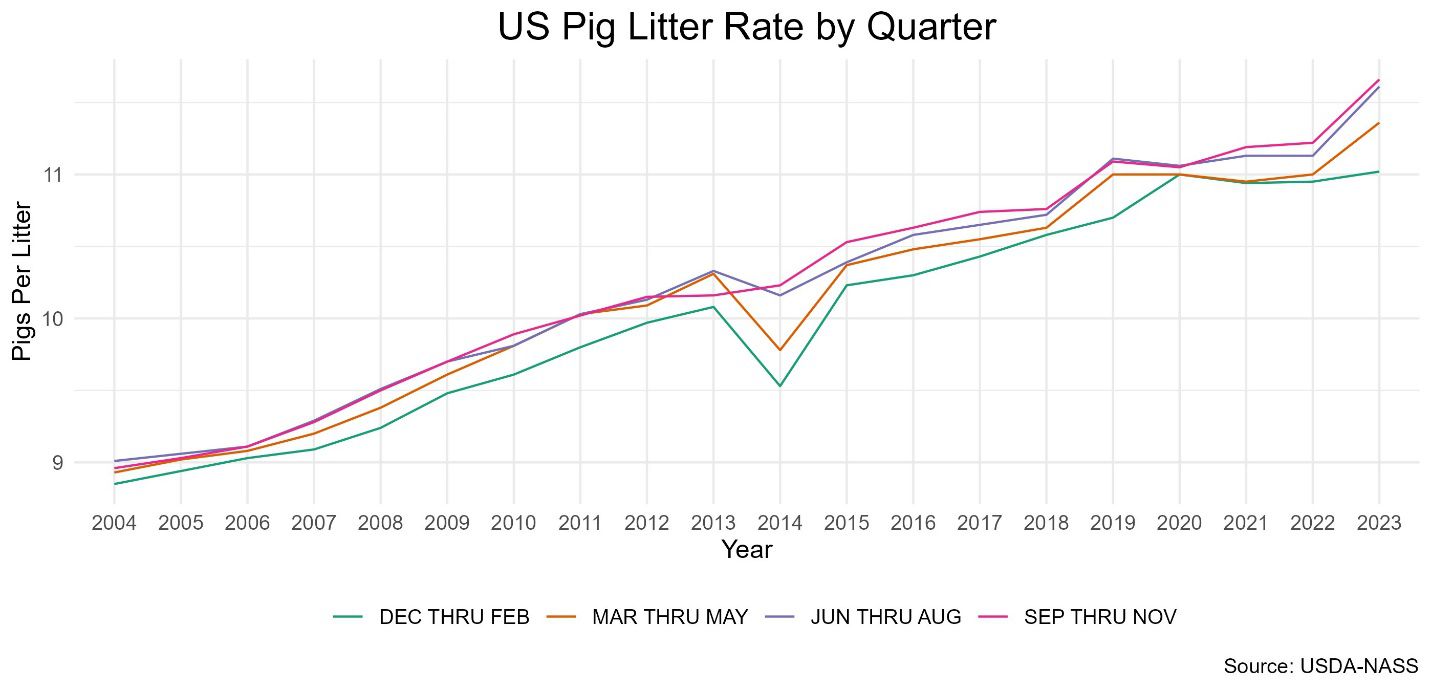
Figure 4. US Pig Litter Rate by Quarter
Want more news on this topic? Farm Bureau members may subscribe for a free email news service, featuring the farm and rural topics that interest them most!