October WASDE Boosts U.S. Corn and Soybean Production Estimates
Author
Published
10/13/2026
Introduction
The USDA released its updated WASDE report on October 9th, 2026. The October WASDE report is the first major monthly report to fully incorporate the data from the late-September Quarterly Grain Stocks report.
2026/2027 Marketing Year
U.S. corn ending stocks increased by 282 million bushels (mb) to 1,849 mb, exceeding market trade expectations by 179 mb. Soybean ending stocks rose 5 mb to 315 mb, outperforming expectations by 10 mb. Wheat ending stocks gained 23 mb, rising to 740 mb, which came in 19 mb over expected. U.S. corn production surged to 16,034 mb, an increase of 234 mb from September and 313 mb more than expected. U.S. corn yield increased nearly 3 bushels per acre (bu/ac) to 181.2 bu/ac, surpassing expectations. U.S. soybean production estimates increased 27 mb to 4,562 mb, outperforming industry predictions and soybean yield increased by 0.3 bu/ac to 53.1 bu/ac. U.S. total wheat production increased 3 mb to 1,534 mb, with hard red winter wheat rising 3 mb to 466 mb, soft red winter wheat rising 7 mb to 294 mb, and white winter wheat rising 12 mb to 292 mb from September to October.
World corn ending stocks increased 8.34 million metric tons (MMT) to 280.44 MMT, surpassing industry expectations by more than 6.00 MMT. World soybean ending rose slightly to 124.28 MMT and aligning with expectations. World wheat ending stocks dipped marginally to 276.04 MMT, while matching expectations.
2025/26 Marketing Year
U.S. corn ending stocks jumped 173 mb to 2,095 mb, soybean ending stocks dropped 10 mb to 315 mb, and wheat ending stocks have remained at 920 mb.
World corn ending stocks increased by 5.78 MMT to 307.16 MMT, exceeding expectations. World soybean ending stocks dipped slightly to 124.93 MMT, aligning with expectations, and world wheat ending stocks grew marginally to 281.55 MMT which outperformed expectations by nearly 5.00 MMT.
South American Markets
Argentina’s corn production for the 2025/26 marketing year increased by 1.00 MMT to 64.00 MMT. Argentina's 2025/26 soybean crop was trimmed 0.2 MMT to 49.3 MMT; Brazil's corn and soybean estimates and Argentina's 2026/27 figures are unchanged.
Table 1 shows key report estimates for both U.S. and world production.
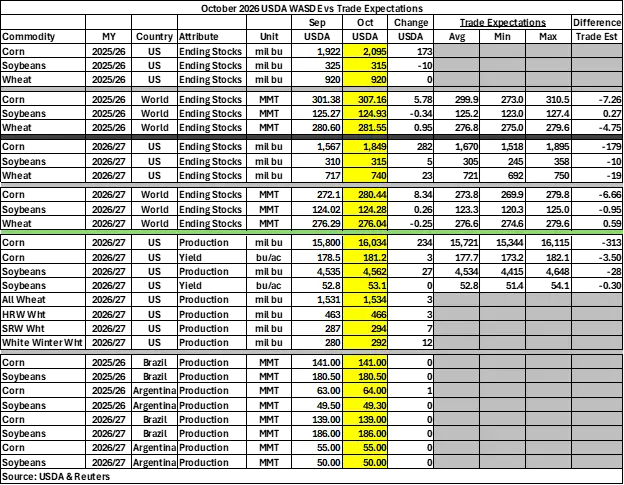
Table 1. October 2026 USDA vs. Market Expectations
Initial Market Reaction
Corn futures initially fell 30 cents within a half hour of the WASDE being released before slowly recouping seven to eight cents. December corn futures fell to $4.73 before slowly growing to $4.80. March corn futures dropped to $4.86 before gaining to $4.94. May corn futures initially steeped to $4.95 before rising to $5.02.
Soybean futures initially fell by 24-25 cents but almost fully recovered by 22 cents by early afternoon. November soybean futures initially dropped to $12.71 but later recovered to $12.92. January soybean futures first fell to $12.88 but then improved to $13.09. March soybean futures initially decreased to $12.97 and later grew to $13.19.
October soybean meal futures initially dropped $4.3/ton to $363.3/ton before eventually climbing to $369.9/ton. December and January soybean meal futures initially $10.4/ton to $352.8/ton and $352.2/ton respectively before recovering by $13/ton.
Prior to the WASDE releasing, October soybean oil futures increased to 67.88 cents per pound. December and January soybean oil futures initially dropped about 0.40 cents per pound before fluctuating and almost recovering to pre-WASDE levels. December soybean oil futures fell to 67.66 cents per pound then fluctuated before rising to 68.03 cents per pound. January soybean oil futures initially dropped to 67.90 cents per pound before rising to 68.26 cents per pound.
Wheat futures initially decreased 22 cents before later gaining eight to nine cents. December wheat futures first dopped to $6.62 then rose to $6.70. March wheat future fell to $6.76 then rose to $6.84. May wheat futures decreased to $6.83 then grew to $6.92.
Changes to Domestic Balance Sheet
This section summarizes changes to the corn and soybean balance sheets in more detail
Table 2 displays the October WASDE corn balance sheet. For the 2025/26 marketing year, area planted decreased by 0.1 million acres to 98.7 million acres. Area harvest decreased by 0.4 million acres to 90.9 million acres. Production fell by 57 mb to 16,964 mb and imports gained 1 mb to 31 mb, resulting in total supply decreasing by 56 mb. Feed and residual decreased by 231 mb to 6,119 mb and food, seed, and industrial dipped 2 mb to 6,903 mb. Ethanol dropped by 3 mb to 5,547 mb and total domestic decreased by 233 mb to 13,022 mb. Exports gained 4mb to 3,429 mb. The changes in total domestic and exports lead to total use decreasing by 229 mb to 16,451 mb. Ending stocks gained 173 mb to 2,095 mb and average farm price gained once cent to $4.16 per bushel.
For the 2026/27 marketing year, yield per harvested acre increased 2.7 bu/ac to 181.2 bu/ac. Production increased 234 mb to 16,034 mb which combined with the carryover stocks result in total supply increasing 407 mb to 18,154 mb. Ethanol gained 50 mb to 5,650 mb. Feed and residual and food, seed, and industrial both increased by 50 mb, resulting in total domestic rising by 100 mb to 13,005 mb. This change in total domestic combined with exports increasing by 25 mb to 3,300 mb results in total use increasing by 125 mb to 16,305 mb. Ending stocks rose 282 mb to 1,849 mb and expected average farm price fell 10 cents to $4.70 per bushel (Table 2).
Table 2. October 2026 WASDE Corn Balance Sheet

Table 3 displays the October WASDE soybean balance sheet. For the 2025/26 marketing year, production dipped by 1 mb to 4,261 mb and imports fell by 3 mb to 22 mb. This results in total supply decreasing by 4 mb to 4,608 mb. Soybean crush decreased 9 mb to 2,646 mb and seed and residual gained 20 mb to 132 mb. This leads to total domestic increasing by 11 mb to 2,778 mb. Exports dropped by 5 mb to 1,515 mb and total use increased by 6 mb to 4,293 mb. Ending stocks loss 10 mb, falling to 315 mb and average price per bushel remained at $10.50 per bushel.
For the 2026/27 marketing year, yield per harvested acre increased marginally to 53.1 bu/ac. Beginning stocks fell 10 mb and production increased 27 mb to 4,562 mb, resulting in total supply gaining 17 mb to 4,902 mb. Seed and residual gained one million bushel to 112 mb, leading to total domestic also gaining one million bushel to 2,892 mb. Exports grew by 10 mb to 1,695 mb and total use increased by 12 mb to 4,587 mb. Ending stocks gained 5 mb to 315 mb.
Table 3. October 2026 WASDE Soybean Balance Sheet

Want more news on this topic? Farm Bureau members may subscribe for a free email news service, featuring the farm and rural topics that interest them most!