Iowa Fall Freeze Date Probabilities
Published
9/19/2018
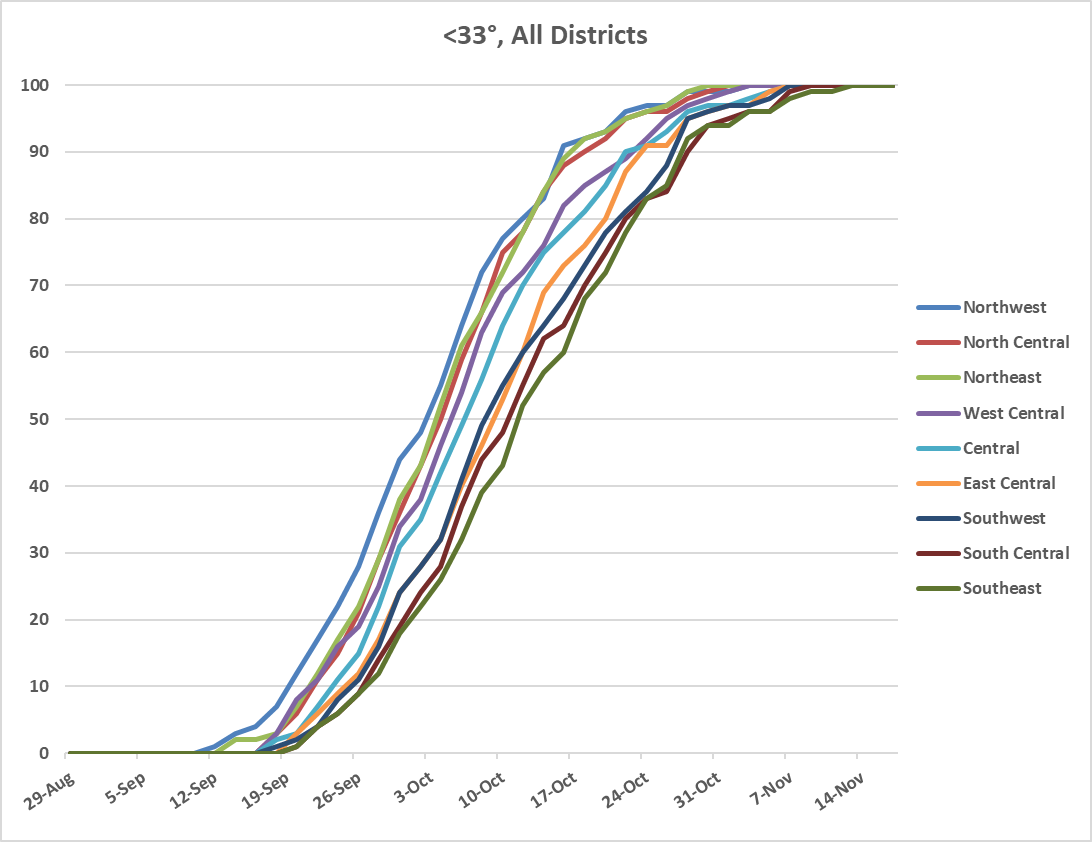
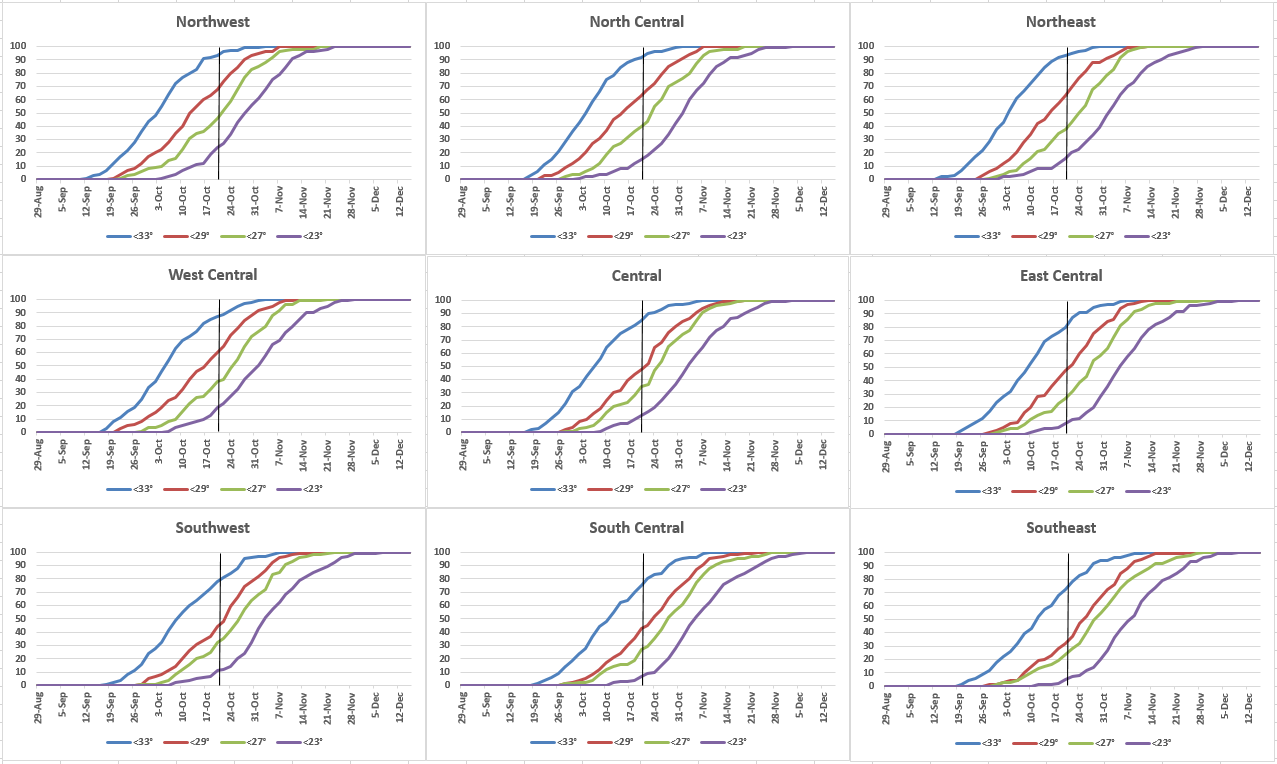
The following graphs demonstrate the first fall freeze probabilities according to Climodat data available from the Iowa Environmental Mesonet (IEM). The data used to calculate the probability of exceeding a certain low temperature shown in the graphs went from 1893-2018. IEM explains this data: On a certain date, what is the chance a temperature below a certain threshold (33, 29, 27, or 23 degrees) would have been observed once already during the fall of that year.
As you can see in the following graphs below, there is a significant difference between the Northwest and Southeast climate divisions. Although there is a low probability, the Northwest division sees its first chance for temperatures below 33 degrees around September 2, whereas the Southeast division is not until around September 20.
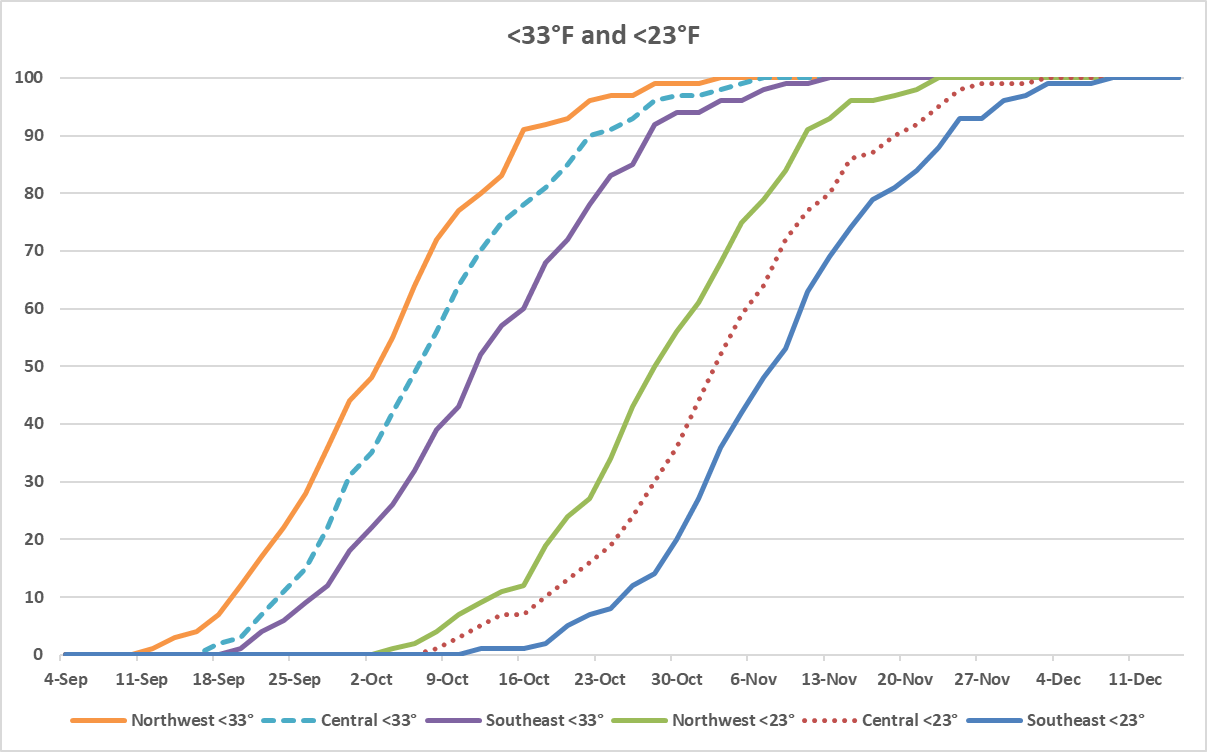
The following graphs show each Iowa climate division with the probability of falling below 33, 29, 27, and 23 degrees. As you can see once again, there is a difference across the state, especially from Northwest down to Southeast Iowa with Southeast facing the chance of temperatures below freezing at a much later date. For example, in Northwest Iowa the probability of 29° (the red line) occurring as of October 20th (the black vertical line) is at 70%, whereas Southeast Iowa only has about a 30% probability of 29° temperatures on October 20th.
Michelle Mensing, Research Analyst, Decision Innovation Solutions (DIS). DIS is an Iowa-based economic research firm which provides regular farm economic research for Iowa Farm Bureau staff & members.
Want more news on this topic? Farm Bureau members may subscribe for a free email news service, featuring the farm and rural topics that interest them most!