Hog Market Update: December 2022
Published
12/27/2022
Hog Market Update: December 2022
Hog Inventory
The inventory of all hogs and pigs in the U.S. on December 1, 2022, was 73.1 million head. This was a 2% decrease from last year, and a 1% decrease compared to last quarter. Market hog inventory was 67.0 million, also down 2% from last year and down 1% from the previous quarter. Breeding hog inventory was 6.15 million, up slightly from last year and up slightly from the previous quarter. Market hogs make up 92% of all hogs.
Figure 1 shows total hog and market hog inventory since 2000 on the left-hand axis and breeding hog inventory on the right-hand axis for the U.S. Hog inventories remain consistent and lower than levels in 2019 and 2020. The breeding herd remains much lower than its peak in 2019.
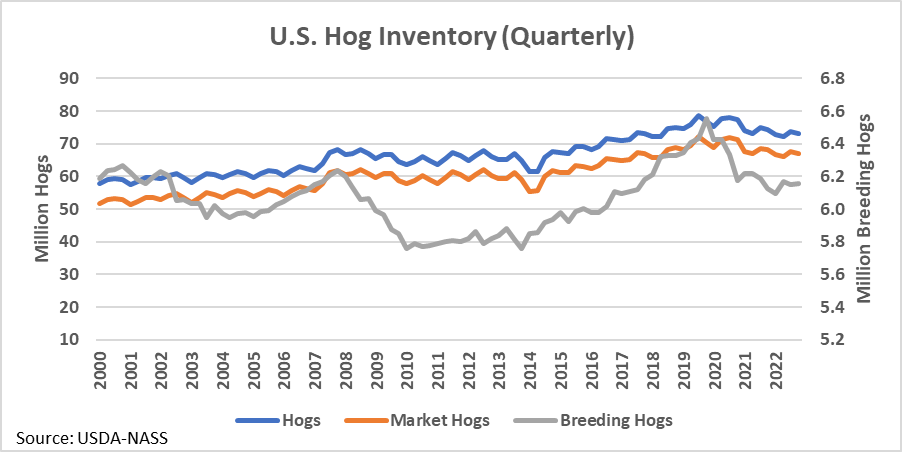
Figure 1. U.S. Hog Inventory (Quarterly)
Iowa hog inventory on December 1, 2022, was 23.6 million head. This was down 1% from last year, but up 1% compared to last quarter. Market hog inventory was 22.7 million, also down 1% from last year but up 1% from the previous quarter. Breeding hog inventory was 930,000, up 1% from the last year and unchanged from the previous quarter. Market hogs continue to make up around 96% of all Iowa hogs. Iowa has relatively more market hogs than breeding hogs compared to the U.S.
Figure 2 shows total hog and market hog inventory since 2000 on the left-hand axis and breeding hog inventory on the right-hand axis for the Iowa. Hog levels have increased over the past two decades, but the breeding herd has declined slightly. Like the U.S., total hog inventory has declined since a peak in 2019.
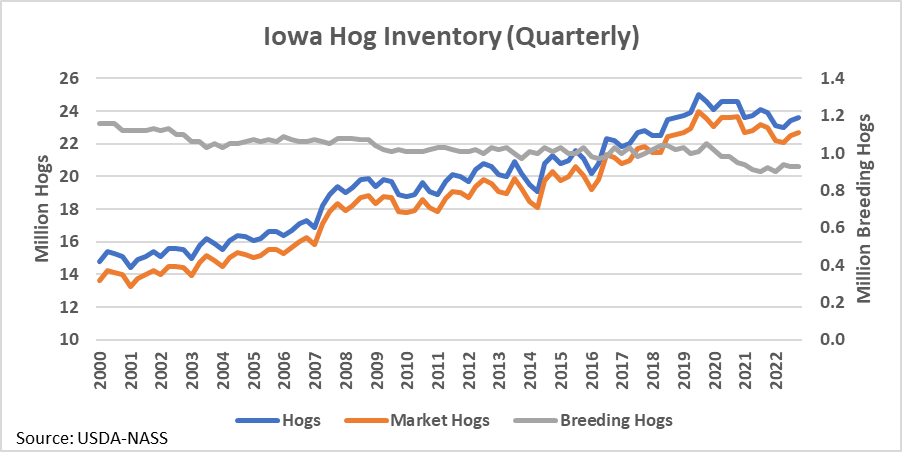
Figure 2. Iowa Hog Inventory (Quarterly)
Pig Crop
The 2022 September-November U.S. pig crop was 33.7 million head, down 1% from last year but up slightly from the previous quarter (Figure 3). Sows farrowing during this period totaled 3.0 million head, down 1.5% from last year and down slightly from last quarter (Figure 4). Despite a decline in the number of sows farrowing, the pig crop was up slightly due to a strong litter rate. Litter size averaged 11.22 pigs per litter, up from 11.19 a year ago and 11.13 last quarter. The U.S. pigs per litter rate has increased 28% since the year 2000.
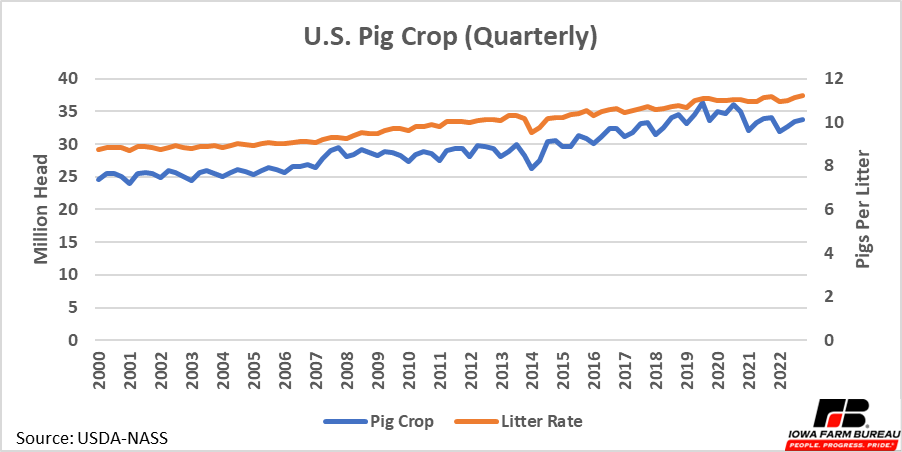
Figure 3. U.S. Pig Crop (Quarterly)
For the next two upcoming quarters the U.S. is forecast to farrow 2.9 million sows from December-February and 3.0 million sows from March to May. This would be similar to the 3.0 million farrowed this past quarter.
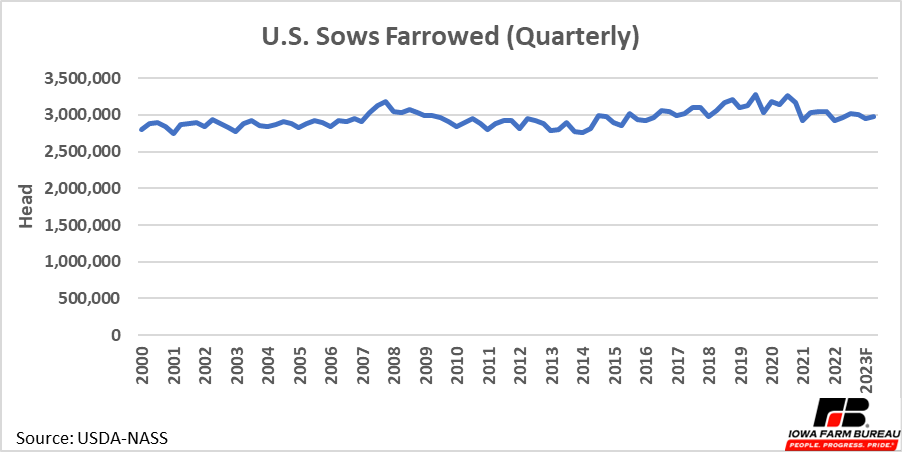
Figure 4. U.S. Sows Farrowed (Quarterly)
For Iowa, the 2022 September-November pig crop was 5.9 million head, down 2% from last year but up 1.6% from the previous (Figure 5). During this quarter Iowa had 510,000 sows farrowing, resulting in 11.55 pigs per litter (Figure 5 and Figure 6). Like the U.S., Iowa’s litter rate has continued to climb, resulting in larger pig crops despite steady sow inventories. Iowa’s pigs per litter rate has increased 30.5% since the year 2000.
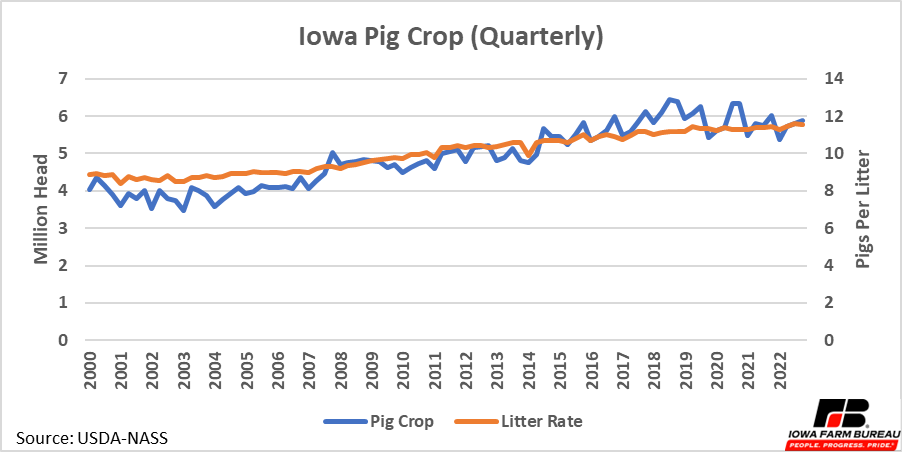
Figure 5. Iowa Pig Crop (Quarterly)
For the next two upcoming quarters the U.S. is forecast to farrow 500,000 sows from December-February and 515,000 sows from March to May. This would be like the 510,000 sows farrowed this past quarter.
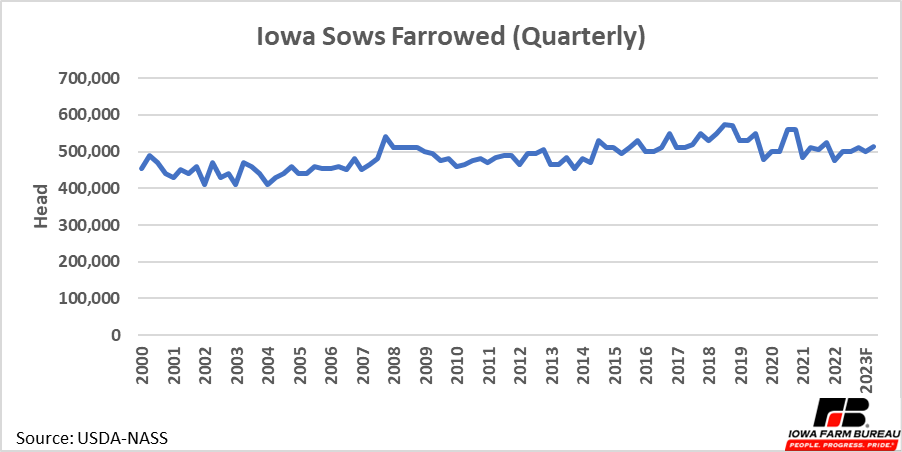
Figure 6. Iowa Sows Farrowed (Quarterly)
Slaughter
No recent shocks have affected hog slaughter. Market hog slaughter started 2022 running nearly 10% below 2021 weekly rates (Figure 7). Some of this was likely due to continued backlog and higher inventories caused by the COVID-19 pandemic in the early part of 2021. By February, weekly market hog slaughter was running 4.5% below 2021 levels. Since the first week of May, market hog slaughter rates have been about equal to 2021 slaughter rates.
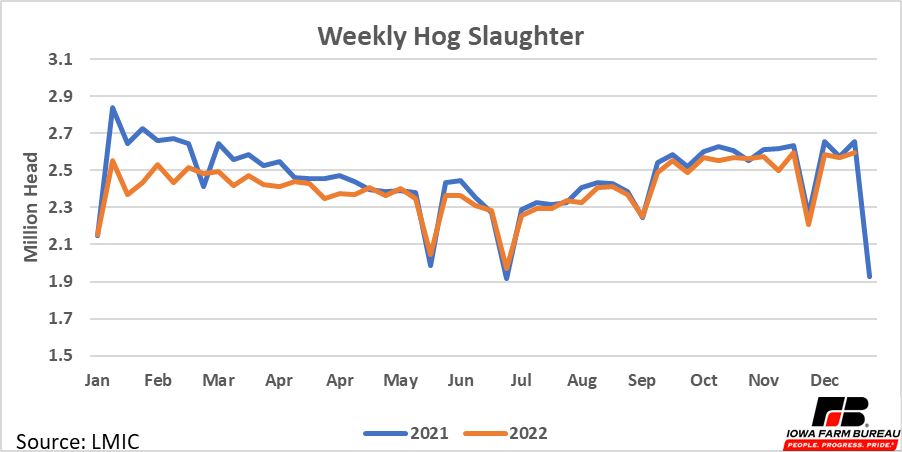
Figure 7. Weekly Hog Slaughter
Exports
Pork exports look to finish the year near 2019 levels (Figure 8). Exports were not able to repeat the strong export sales of 2020 and 2021. The dollar index and China’s rebounding hog herd likely contributed to lower exports in 2022.
The dollar index increased for most of the year, reaching its highest point from September to November. A higher dollar compared to other foreign currencies puts downward pressure on export sales, as it makes U.S. pork relatively more expensive to other countries.
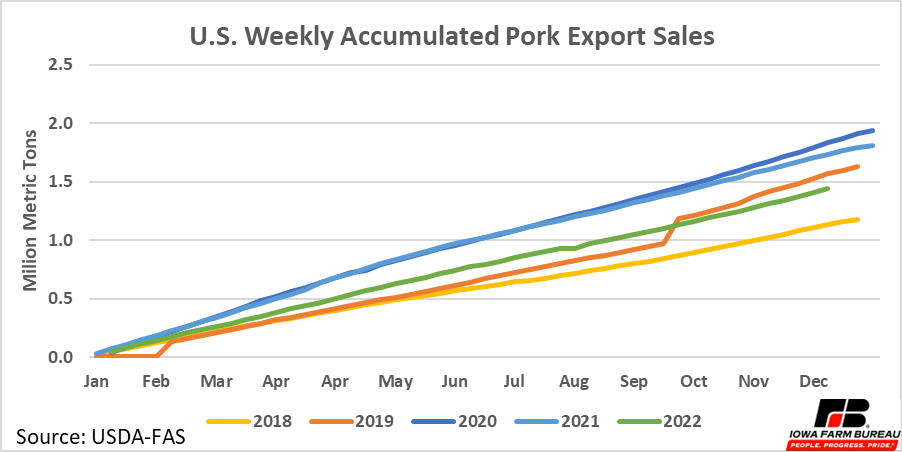
Figure 8. U.S. Weekly Accumulated Pork Export Sales
Furthermore, China’s pork herd suffered from African Swine Fever in 2020 and 2021 causing their pork production to decrease and pork imports to increase in those years. China’s pork production has since rebounded and U.S. pork exports to China have slowed in 2022 (Figure 9); still above3 pre-pandemic export rates but substantially lower than the last 3 years.
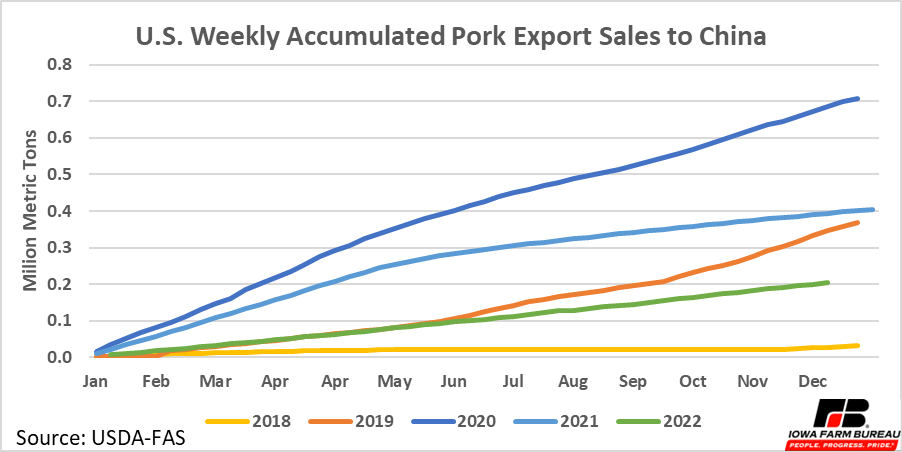
Figure 9. U.S. Weekly Accumulated Pork Export Sales to China
Prices
Weekly market hog prices have followed a seasonal pattern over the last few years, typically peaking in July and recording lows in December and January. COVID-19 broke this price pattern in 2020 but all other years from 2015-2022 have followed the general trend. Both 2021 and 2022 have seen higher prices than in the previous six years but have continued to follow the seasonal pattern.
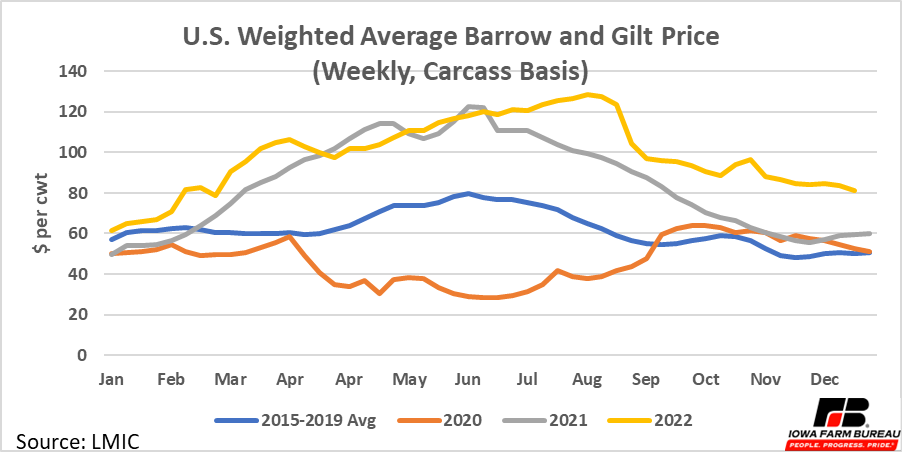
Figure 10. U.S. Weighted Average Barrow and Gilt Price
Despite slower export sales, 2022 hog prices were higher than 2021 prices for most of the year. Prices started the year about 20% higher than 2021 prices and other than a few months in the spring and early summer have remained higher than 2021 prices (Figure 10). Moreover, hog prices had been peaking in June in previous years, but 2022 prices peaked in late August in 2022. Since the peak, prices have decreased substantially, down 37% from the seasonal high, yet they remain above 2021 levels.
Some of the higher price is due to inflation. But even after adjusting for inflation, 2022 hog prices are still better than 2021 hog prices (Figure 11). The gap between the two prices is smaller, but 2022 hog prices are still higher than 2021 prices for most of the year.
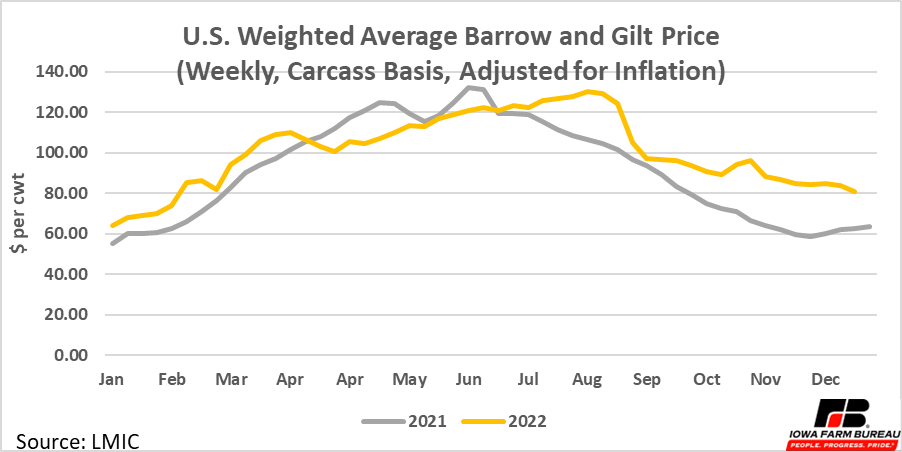
Figure 11. U.S. Weighted Average Barrow and Gilt Price
Economic analysis provided by Aaron Gerdts, Research Analyst, Decision Innovation Solutions on behalf of Iowa Farm Bureau.
Want more news on this topic? Farm Bureau members may subscribe for a free email news service, featuring the farm and rural topics that interest them most!