February 2026 WASDE Update
Author
Published
2/11/2026
The USDA released its updated WASDE report on February 10th, 2026.
(Current) 2025/26 Marketing Year
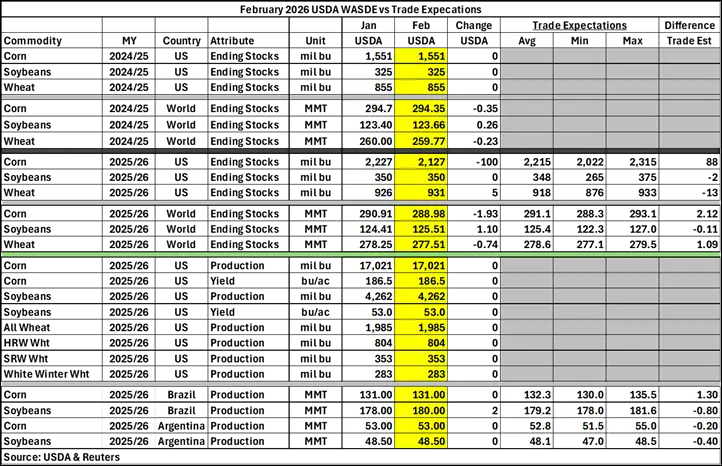
U.S. corn ending stocks decreased by 100 million bushels (mb) to 2,127 mb, falling short of average industry expectations by 88 mb. Soybean ending stocks stayed constant at 350 mb, topping trade expectations by 2 mb. Wheat ending stocks increased by 5 mb to 931 mb, outperforming expectations by 13 mb.
World corn ending stocks decreased by 1.93 million metric tons (MMT) to 288.98 MMT, while also falling under trade expectations by 2.12 MMT. World soybean ending stocks increased marginally by 1.10 MMT to 125.51 MMT, while also aligning with average trade expectations of 125.40 MMT. World wheat ending stocks fell slightly by 0.74 MMT to 277.51 MMT, marginally underperforming expectations by 1.09 MMT.
(Prior) 2024/25 Marketing Year
U.S. corn, soybean, and wheat ending stocks all remained the same in the February WASDE.
World corn and wheat ending stocks decreased slightly by 0.35 MMT and 0.23 MMT to 294.35 MMT and 259.77 MMT respectively. World soybean ending stocks increased marginally by 0.26 MMT to 123.66 MMT.
Foreign Markets
The USDA’s Brazil and Argentina corn and soybean production estimates remain unchanged for the 2025/26 marketing years except for Brazil’s soybeans which increased by 2 MMT to 180.00 MMT. Brazil’s corn production estimates underperformed trade expectations by 1.30 MMT and soybean production estimates surpassed expectations by 0.80 MMT. Argentina’s corn and soybean production estimates both slightly by 0.20 MMT and 0.40 MMT respectively.
Table 1shows some key report estimates for both U.S. and World production.
Table 1. February 2026 USDA WASDE
Initial Market Reaction
Corn futures contracts rose slightly by 1-2 cents immediately after the release of the WASDE. March corn futures rose to $4.29 initially before fluctuating and closing at $4.28. May corn futures rose to $4.37 initially and fluctuated before closing at that number. July corn futures initially rose to $4.44 before fluctuating and closing at $4.45.
Soybean futures were trending upwards prior to the WASDE releasing. March soybean futures initially rose by a cent to $11.20 and closed at $11.23. May soybean futures increased by 2 cents to $11.35 initially and closed at $11.38. July soybean futures increased to $11.46 initially and fluctuated before closing at $11.50.
Soybean meal futures contracts decreased by $1-2 per ton initially. March soybean meal futures fell to $301.0/ton and closed at that. May soybean meal futures decreased to $305.5/ton and July soybean meal futures decreased to $310.2/ton.
Soybean oil futures contracts trended upwards prior to the WASDE release and initially increased by about 0.21 cents per pound. March soybean oil futures increased to 57.04 cents per pound and continued rising to 57.25 cents per pound. May soybean oil futures rose to 57.41 cents per pound initially and continued rising to 57.73 cents per pound. July soybean oil futures initially increased to 57.0 cents per pound and continued rising to 57.90 cents per pound.
Wheat futures contracts decreased by 1-2 cents immediately after the WASDE released. March wheat futures fell to $5.25 initially and recovered to close at $5.29. May wheat futures decreased to $5.35 initially and fluctuated before closing at $5.38. July wheat futures fell to $5.46 initially before fluctuating and closing at $5.49.
Changes to Domestic Balance Sheets
This section summarizes changes to the corn and soybean balance sheets in more detail.
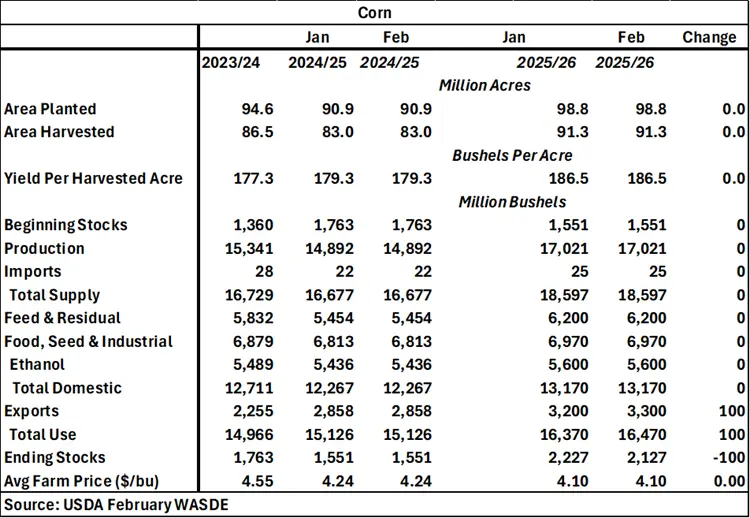
For corn, there were no changes to the (prior) 2024/25 marketing year balance sheet.
For the (current) 2025/26 marketing year, exports increased by 100 mb to 3,300 mb, resulting in the same increase in total use to 16,470 mb. Thus, corn ending stocks decreased by 100 mb to 2,127 mb and expected average farm price remained constant at $4.10 per bushel (Table 2).
Table 2. February 2026 WASDE Corn Balance Sheet
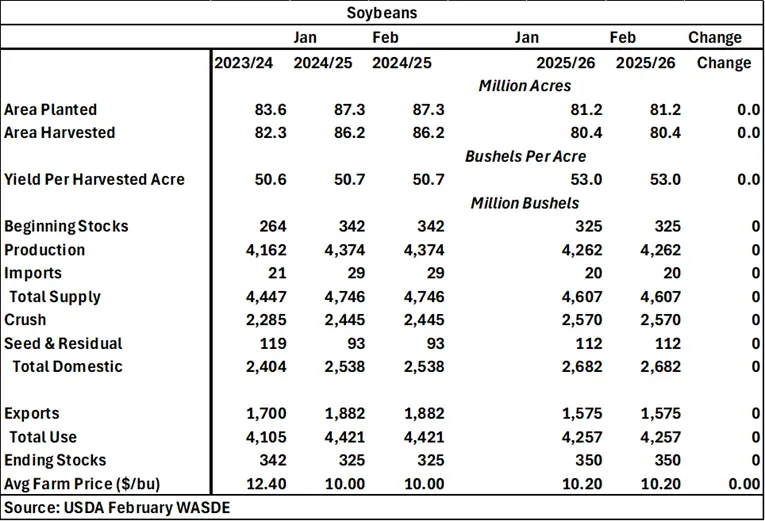
For soybeans, there were no changes to the (prior) 2024/25 marketing year balance sheet.
There were no changes in the (current) 2025/26 marketing year soybean balance sheet (Table 3).
Table 3. February 2026 WASDE Soybean Balance Sheet
Want more news on this topic? Farm Bureau members may subscribe for a free email news service, featuring the farm and rural topics that interest them most!