Corn Ending Stocks Fall Below Expectations in July WASDE
Author
Published
7/13/2026
Introduction
The USDA released its updated WASDE report on July 10th, 2026. The July WASDE report is the first to include wheat-by-class projections for the 2026/27 crop year. July planted and harvested acres are from the June 30th Acreage Report and yield estimates are based on a weather-adjusted trend model and assumes normal weather.
(New) 2026/27 Marketing Year
U.S. corn ending stocks decreased by 170 million bushels (mb) to 1,790 mb, falling 109 mb under trade expectations. Soybean ending stocks stayed constant but also underperformed expectations by 22 mb. Wheat ending stocks dropped 22 mb to 722 mb and aligned with trade expectations. U.S. corn production increased by 5 mb, U.S. soybean production rose by 40 mb, and total wheat production decreased by 7 mb.
World corn ending stocks fell nearly 6 million metric tons (MMT) to 275.26 MT, about 4 MMT than expected. World soybean stocks decreased marginally to 124.17 MMT, falling just 1.03 MMT less than trade expectations. World wheat ending stocks dipped 2.58 MMT to 272.84 MMT, aligning with industry expectations.
2025/26 Marketing Year
U.S. corn ending stocks dropped 125 mb to 2,020 mb, falling 58 mb short of trade expectations. Soybean ending stocks decreased 10 mb to 330 mb and slightly underperformed expectations, while wheat ending stocks dropped 15 mb to 920 mb.
World corn ending stocks fell nearly 5 MMT to 298.67 MMT, while soybean and wheat ending stocks dipped marginally to 125.03 MMT and 279.04 MMT respectively.
South American Markets
Argentina’s corn production estimate increased by 2 MMT to 63.00 MMT, while there were no changes to all other corn and soybean production estimates for the 2025/26 and 2026/27 marketing years.
Table 1 shows key report estimates for both U.S. and world production.
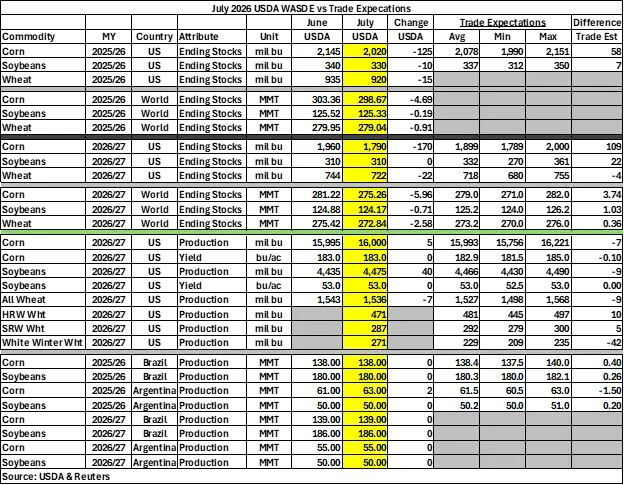
Table 1. July 2026 USDA vs. Market Expectations
Initial Market Reaction
July corn futures were $4.32 prior to the WASDE releasing and rose to $4.34 within 30 minutes of it being released. July corn futures continued rising to $4.38 midafternoon. September corn futures were $4.35 and jumped to $4.37 shortly after the report released, before rising to $4.38 midafternoon. December corn futures rose 2 cents to $4.58 within 30 minutes of the WASDE being released and continued rising to $4.60.
July soybean futures rose from $11.84 in the morning to $11.97 shortly after the report was released. August soybean futures rose 3 cents to $11.90 within 30 minutes of the WASDE and continued rising to $11.90 later in the afternoon. September soybean futures fluctuated, initially rising 2 cents to $11.79 before dipping then recovering to $11.82 within an hour.
July soybean meal futures rose by $0.9/ton to $325.8/ton. August soybean meal futures fell by $1.6/ton to $321.2/ton, then fluctuated before falling to $319.7/ton. September soybean meal futures fall $1.9/ton to $318.0/ton and continues to drop to $316.3/ton.
Soybean oil futures initially rose around 0.19 cents per pound before fluctuating throughout the afternoon. August soybean oil futures initially increased to 70.68 cents per pound, September soybean oil futures rose to 70.16 cents per pound, and October soybean oil futures initially increased to 69.55 cents per pound.
July wheat futures rose to $6.34 within a half hour of the WASDE releasing. September wheat futures peaked at $6.48 before the WASDE released but fell to $6.40 within a half hour. December wheat futures followed the same trend, initially dropping 8 cents to $6.53.
Changes to Domestic Balance Sheets
This section summarizes changes to the corn and soybean balance sheets in more detail.
Table 2 displays the July WASDE corn balance sheet. For the 2025/26 marketing year, feed and residual increased 150 mb to 6,350 mb. Food, seed, and industrial and ethanol both fell 25 mb to 6,905 mb and 5,550 mb respectively. Total domestic and total use both increased 125 mb to 13,255 mb and 16,580 mb respectively. Ending stocks fell 20 mb to 2,020 mb while expected average farm price per bushel remains at $4.15.
For the 2026/27 marketing year, beginning stocks are down 125 mb to 2,020 mb, production is up 5 mb to 16,000 mb, total supply fell 120 mb to 18,045 mb, exports are up 50 mb to 3,200, and total use increased 50 mb to 16,255 mb. Ending stocks dropped 170 mb to 1,790 mb while average farm price is unchanged at $4.40 per bushel.
Table 2. July 2026 WASDE Corn Balance Sheet
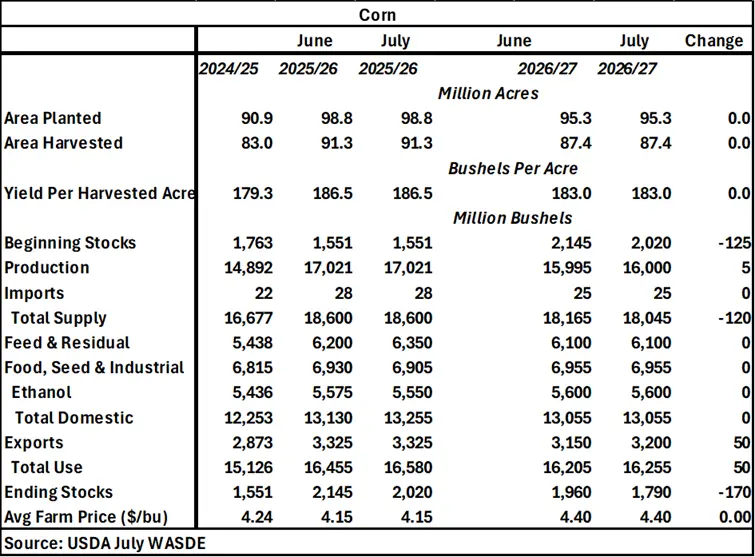
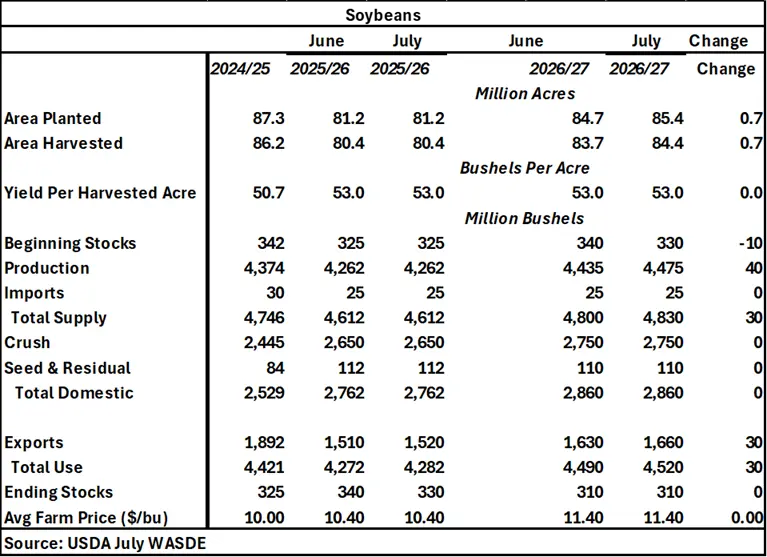
Table 3 displays the July WASDE soybean balance sheet. For the 2025/26 marketing year, exports rise 10 mb to 1,520 mb, leading to total use increasing to 4,282 mb and ending stocks fell to 330 mb. Average farm price is unchanged at $10.40 per bushel.
For the 2026/27 marketing year, area planted and harvested both increased 700,000 acres to 85.4 million acres and 84.4 million acres respectively. Beginning stocks fell 10 mb to 330 mb and production increased 40 mb to 4,475 mb, leading to total supply increasing by 30 mb to 4,830 mb. Exports and total use both increased by 30 mb to 1,660 mb and 4,520 mb respectively. Average farm price is unchanged at $11.40 per bushel.
Table 3. July 2026 WASDE Soybean Balance Sheet
Want more news on this topic? Farm Bureau members may subscribe for a free email news service, featuring the farm and rural topics that interest them most!